Before we begin:
SAP Smart Business is
a framework for exposing strategic (key) and operational performance indicators (KPIs, OPIs) as Fiori applications without the need to write any code.
It can be used by customers, partners and SAP’s development teams for making highly aggregated analytical data accessible via Fiori Launchpad tiles.
I have included the necessary blogs and help pages which will catapult your adoption of SAP Smart Business at the end of this article.
SAP SmartBusiness is providing you the tools to be make your predictions as easy as clicking your “mouse” button.
Here we combine your data with strength of SAP HANA’s Predictive Analytical Library to provide you with graphical prediction results which are quick and easy to understand, consequently, enabling you to simplify your critical business decisions.
How to Configure Predictions in a Drilldown
Prequisites
- Create a KPI and an Evaluation.
- Activate the evaluation and create a drilldown.
Procedure
- In Smart Business Modeler apps, click on Configure KPI Drilldown.

2. Select your activated Evaluation
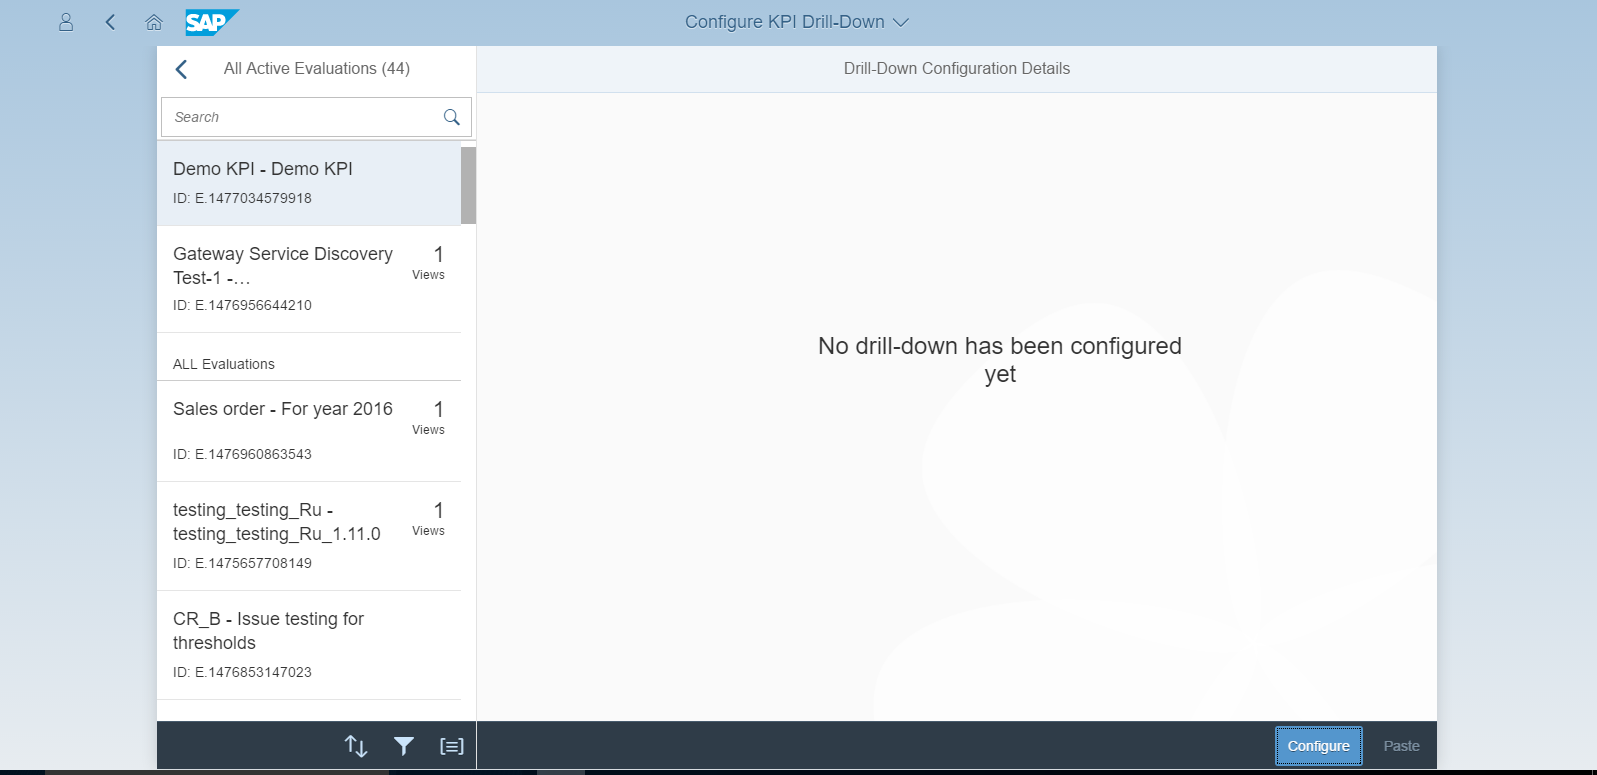
3. Click the Configure button.
4. Choose the required Dimensions and Measures from the list displayed.
You could use the filter to find the Dimension or Measure you are looking for.
Once found click on the corresponding Check-Box.
INFORMATION: At least one Measure has to be chosen mandatorily.
A sample selection list is displayed below:

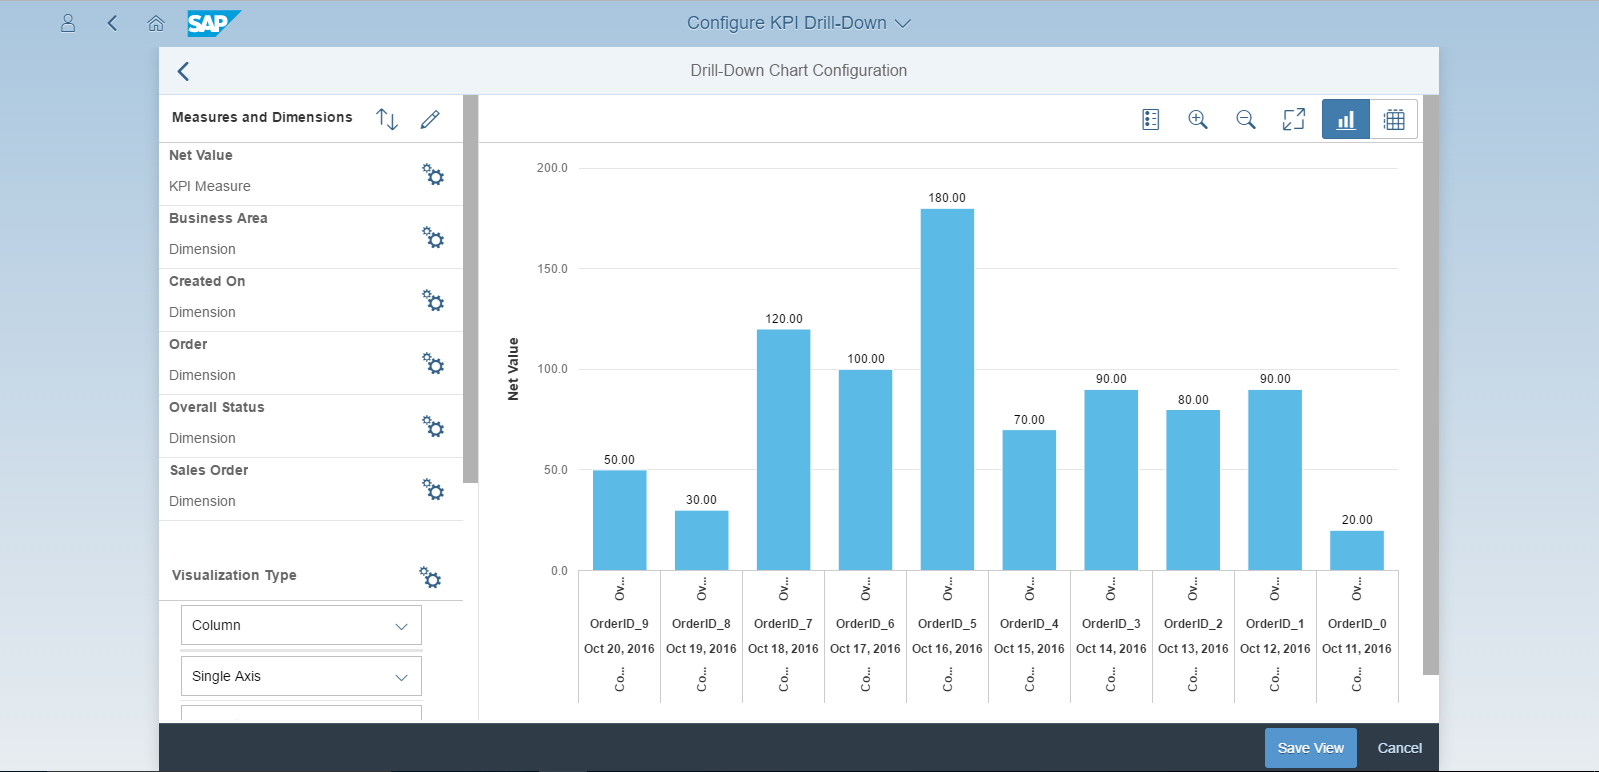
5. Click ‘OK’ button and the data is displayed using a graph.
WARNING: The data displayed is NOT the actual data from the Data Source, but dummy data.
6. User is allowed to change the values and the order of data elements using buttons

and


7. Select a chart type from the ‘Visualization Type’.

8. Provide an appropriate View Title in the field represented below.

9. You may add additional language support using the link ‘Additional Languages’.
A popup will be displayed to user, and the user can choose the language they need.
9.1. Provide an appropriate title
9.2 Choose the language from the drop-down.
9.3 Click on the ‘+’ button.
9.4 Press OK, once all required languages are added.

10. You may choose to limit the number of records to be fetched using the option :’ Limit Data Records’
10.1. A text-box will appear and you can provide the number of records to be fetched as appropriate.
A sample representation is given below:

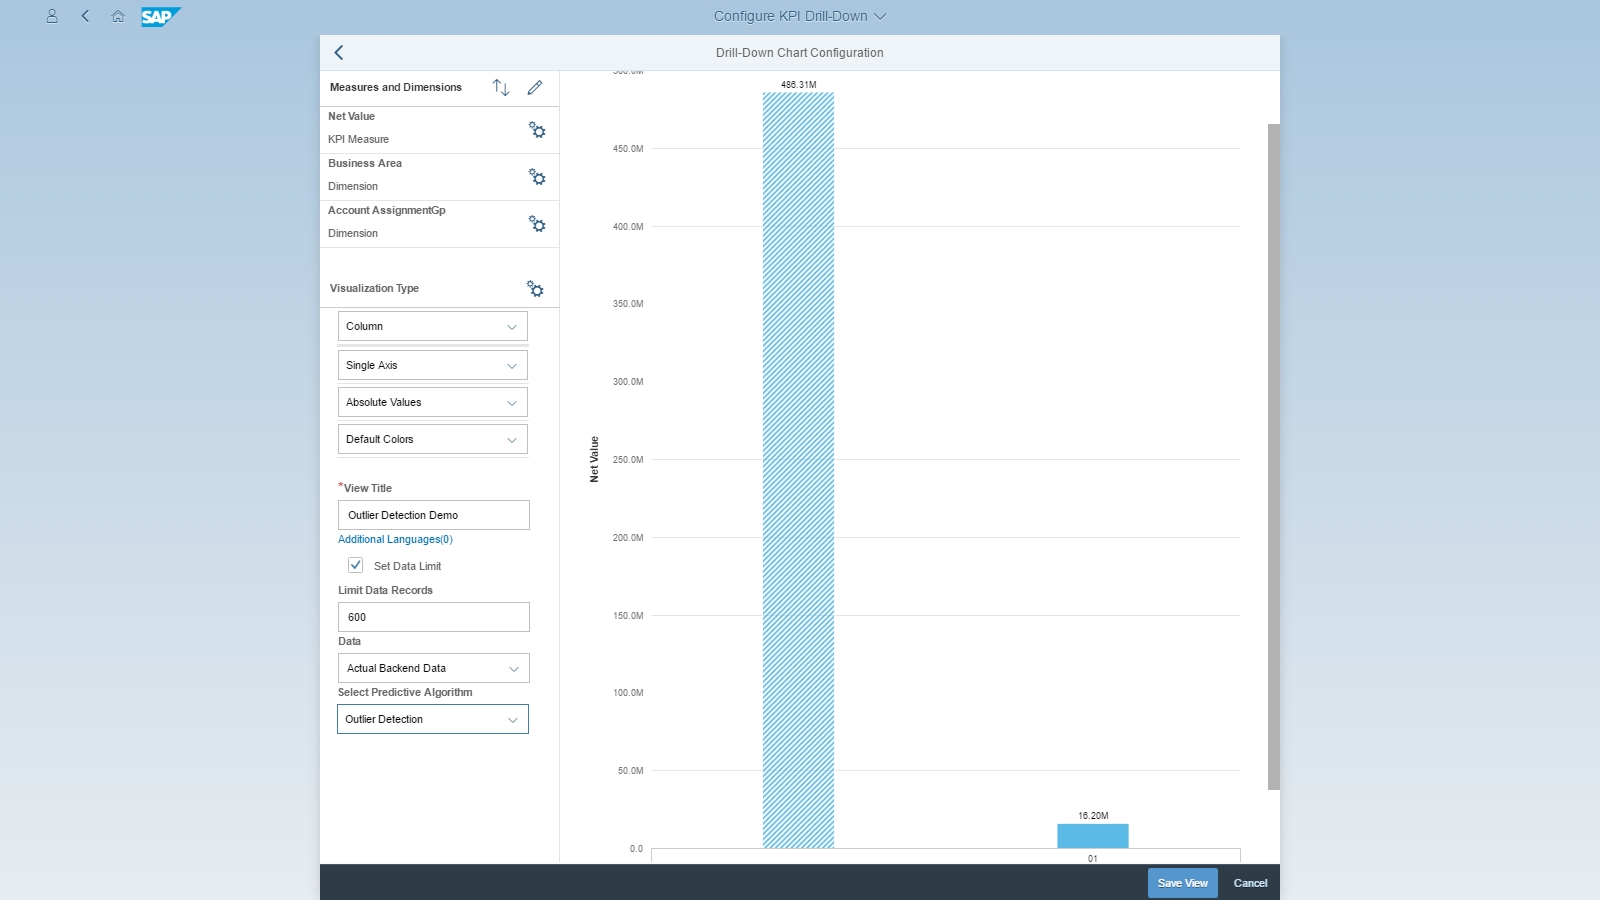
11.Choose Outlier detection with either Dummy data or Actual backend Data.
If you choose Dummy data, you will view the chart based on a pre-defined set of data. If you choose Actual backend Data, you will view the chart based on the customer data and the anomaly on this data will be calculated in process.

12. On the Select Predictive Algorithm dropdown list, choose either None or Outlier detection.
If you choose
None, then a normal drilldown will be created.

If you choose
Outlier detection(also called
Anomaly Detection), then a drill-down will be created using the Outlier algorithm to analyze the data based on the measure and dimensions chosen. You can identify an outlier by the
diagonal pattern on the column, or a
dotted line in a Line chart. Also, the legend will show the Outlier.
 INFORMATION: Depending on the choice the graph display will change.
Diagonal pattern in Bar Chart(Sample representation only).
Dotted line pattern in Line Chart(Sample representation only).
 Supported Chart Types
In Visualization Types, if Outlier detection is selected then only a few chart types are enabled for this functionality, as follows:
Chart Type |
Enabled |
Column |
True |
Bar |
True |
Line |
True |
Combination |
False |
Bubble |
False |
Donut |
False |
Pie |
False |
Scatter |
False |
Table |
False |
Timeseries line |
False |
Geo Map |
False |
Heat Map |
False |
Vertical Bullet |
False |
If you select a chart type other than the Column, Bar or Line chart, then Outlier Detection will not be enabled.
Supported Colors
If Outlier detection is selected then only Default colors is enabled. Semantic and Manual colors are not supported in Predictions.
Colors |
Enabled |
Default Colors |
True |
Auto Semantic Colors |
False |
Manual Semantic Colors |
False |
Manual Colors |
False |
Documents and Blogs on Smart Business Service
Help Document
https://help.us1.hana.ondemand.com/ssb_service/frameset.htm
Blogs
Note: In case you face any issue with Smart Business Service, you can create an Incident on
SAP Support Portal with the components: CA-GTF-SB-HCP. You may also contact Smart Business team at
smartbusiness@sap.com
