
- SAP Community
- Products and Technology
- Technology
- Technology Blogs by Members
- Health checks of HANA system
Technology Blogs by Members
Explore a vibrant mix of technical expertise, industry insights, and tech buzz in member blogs covering SAP products, technology, and events. Get in the mix!
Turn on suggestions
Auto-suggest helps you quickly narrow down your search results by suggesting possible matches as you type.
Showing results for
former_member25
Explorer
Options
- Subscribe to RSS Feed
- Mark as New
- Mark as Read
- Bookmark
- Subscribe
- Printer Friendly Page
- Report Inappropriate Content
09-04-2017
6:11 AM
Dear Readers,
As HANA administrators we often think about how to keep a HANA system healthy, what are the things we need to check to ensure that all the things that are necessary for good performance of the system are in place. One way to do that is using the SQL scripts provided by SAP in OSS note 1969700 - SQL Statement Collection for SAP HANA
This OSS note provides a collection of very useful SQL scripts with which you can check a wide range of areas that are critical to a HANA system. In this blog, I will be describing how you can use these scripts to maintain good health of your HANA systems. I would suggest to perform these checks every 6 months.
Note: Some of these SQL scripts are version dependent, so you need to use the one which suits your version.
Description: SAP introduced the concept of hybrid LOBs from SPS07 onwards. Upto SPS06 memory LOBs were used for storing large objects. The disadvantage of memory LOBs was that when any query accessed the columns containing memory LOBs, the entire column along with the LOBs had to be loaded into memory leading to higher memory usage. With hybrid LOBs, the LOB data is only loaded into memory when it's size doesn't exceed a certain configurable threshold (1000 bytes by default), otherwise it resides on disk.
Executing the SQL script “HANA_Configuration_HybridLOBActivation_CommandGenerator” gives you the table name and the column name which has memory LOBs and also the commands to convert them into hybrid LOBs.

Action: Open an SQL console and execute the "Alter table ..." commands from the output of the SQL script. For more information, refer to OSS notes 1994962 - How-To: Activation of Hybrid LOBs in SAP HANA and 2220627 - FAQ: SAP HANA LOBs
Description: This script checks for tables and hybrid LOB containers that are located on different hosts. If they are located on different hosts, it has a significant performance impact as it will increase the network data transfer time, leading to increased time in query execution accessing the LOBs.
From the output of the script you can see the table name, the host in which the table is located and the host in which the LOB containers are located.

Action: You can use this SQL statement to relocate them to the same host.- alter table "<schema_name>"."<table_name>" move to '<target_host>:<target port>' PHYSICAL
Note that the option “physical” is important here. Without the physical option the table data will be moved to the target host excluding the LOB data. Using physical option moves the LOB data as well.
Description: This script gives you the fragmentation information of the data and log files. Usually it’s the data files that gets fragmented over the time so by default the script considers data files only for reporting. In the modification section you can update the PORT as ‘%03” so that only indexserver data files are reported. This is to avoid reporting of data files of other services like scriptserver and xsengine as those are very small in size and defragmenting those will not yield any positive results and is not desired.
Check the column “Fragmentation_Pct”. If the fragmentation percentage is considerable, say more than 40 or 50% then it’s worth doing defragmentation of that data file.

Action: You can execute defragmentation of the data files using the command - Alter system reclaim datavolume ‘<host>:<port>’ 120 defragment
You must take some precautionary measures if you have system replication enabled. You need to ensure that no replication snapshots exist in the system when you are running defragmentation otherwise the defragmentation will fail with the error message “general error: Shrink canceled, probably because of snapshot pages SQLSTATE: HY000”. Refer to OSS note 2332284 - Data volume reclaim failed because of snapshot pages and change the parameters as suggested then perform the defragmentation.
Description: You can use this script to check the avg. commit time of the data files for all nodes of your environment.

Action: From the example above, you can see that the avg. commit time for node 13 is too high. With almost the same number of commits, the avg. commit time of node 11 is much less. The main reason is that the I/O time for the indexserver data file of node 13 is higher compared to other nodes hence increasing the commit time. In such scenarios you need to contact your OS team and ask them to check for I/O issues in the persistent layer. Refer to OSS note 1999930 - FAQ: SAP HANA I/O Analysis for more info on I/O analysis.
Also if you have system replication enabled, low thoughput in the system replication network between the primary servers and the secondary servers can increase the commit time on primary significantly, especially if you are using "logreplay" operation mode. You can check the throughput by executing the command hdbcons -e hdbindexserver "replication info" at the OS level of the primary server. Look for the value of "shippedLogBufferThroughput". If the throughput is too low you should contact your OS team and ask them to check the servers on the secondary site. Sometimes hardware issues on the secondary site can decrease the throughput.
The benchmark for avg. commit time is < 10 ms.
Description: You can run this script by updating the start and end time as per your requirement in the modification section. Also at the bottom of the script I prefer to use the column MAX_BLK_S in the order by clause. This will give you the savepoint statistics of all the nodes within the chosen time period sorted by the max blocking period. You will get a result like below.

The column MAX_BLK_S gives you the blocking period of the savepoints and the column MAX_CRIT_S shows the critical phase duration. From the example above, you can see the blocking phase duration of some of the savepoints is high but the critical phase duration is low.
Savepoint phases can be categorized as below in the order of their occurrence –
Phase 1: Pageflush
Phase 2: Critical phase
Phase 2.1: Blocking phase
Phase 2.2: Critical phase
Phase 3: Post critical
Phase 2 is the most important phase which has severe impact on system performance if that phase takes longer time to complete. During the blocking phase, the system waits for acquiring lock. Once it acquires the lock it then enters the critical phase to write the data into persistence. If either the blocking or the critical phase is too high, it will impact the system performance because no DML operations are permitted in the system during this phase. This manifests in the form of long running sessions and long running threads. All threads performing DML operations like insert, update, delete will get blocked until the lock is released by the savepoint blocking phase. This will lead to severe system slowness.
Action: The blocking phase duration can be high because of bugs in the HANA revisions or some other reasons as well. Check OSS note 2100009 - FAQ: SAP HANA Savepoints, section 6 “How can typical savepoint issues be analyzed and resolved?” and 1999998 - FAQ: SAP HANA Lock Analysis, section 6 “How can internal lock waits be analyzed?”
I have also observed that if you have low throughout in the system replication network between primary and secondary systems, the savepoint blocking phase duration can increase significantly when a full initial load is going on between primary and secondary and also at other times as well. Refer to the section "HANA I/O Commits" above to see how to measure the system replication throughput. So this is another area that you need to check if you are observing high savepoint blocking phase duration very frequently.
If the critical phase duration is high, it is most likely due to I/O issues at the persistence layer. You can check 1999930 - FAQ: SAP HANA I/O Analysis for likely causes and solution. Also you can run the SQL script HANA_Configuration_MiniChecks and refer to the value of savepoint write throughput. It should be > 100 mb/s at least. If this this lesser than 100 mb/s then you should contact your OS/hardware team.
Note that these things change a lot with new HANA revisions so you should watch the latest version of the above-mentioned OSS notes to get updated information. For e.g. consistent change lock is not acquired anymore during the blocking phase from SPS11 onwards.
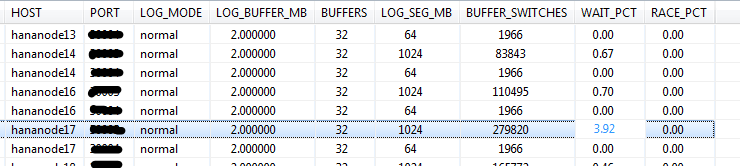
Description: Ececuting this script shows you the log buffer wait count ratio and the log buffer race count ratio. Both should not be more than 1. In the example below you can see the log switch wait count ratio is little high for node 17.
Action: There can be several ways to investigate this. You can increase the log buffer size and/or number of log buffers. Refer to OSS note 2215131 - Alert Log Switch Wait Count Ratio. Note the caution mentioned in the note on the side effect of increasing the log buffer size too much.
There can also be I/O issues at the hardware level which may slow down the write speed from log buffers to persistence hence increasing the wait time for log buffer switch. You can download the hardware configuration check tool from OSS note 1943937 - Hardware Configuration Check Tool - Central Note and compare the throughput of your system with the benchmark provided in the pdf document attached to the note.
Another reason can be sub-optimal distribution of data if you are using a scaled-out landscape. If the load on some servers are too high compared to other nodes, it may lead to a high log buffer wait count ratio on those nodes. You can perform a table redistribution operation to ensure that tables are optimally distributed across all nodes so that only few nodes are not overloaded.
Description: You can use this script to check the partitioning details of all tables. You can update the parameter "MIN_NUM_PARTITIONS" to 100 in the modification section of the script so that the output of the script shows only those tables that has more than 100 partitions. Having too many partitions can cause adverse performance impact as any query which is not using the partitioning column in their where clause will have to scan all the partitions. Also there is a limit on the maximum number of partitions allowed for one table, 1000 till SPS09 and 16000 from SPS10 onwards. So you need to keep a watch on the tables having the highest number of partitions.

Action: 1. First you need to find out the hosts where all the partitions reside. From HANA studio under the system, right click on the "catalog" and click on find table. Enter the table name and go to the "Runtime information" tab. At the bottom section "Details for table" under the sub-section "Parts" you can see the hosts where the partitions reside. See screen shot below.
From here you can see the table has 6 partition groups each partition groups having several partitions each.

2. Execute the SQL query - alter table <table_name> move partition <partition group no.> to '<host>:<port>', where partition group no is the number that you see on the left half of the screen shot above, to move all the partitions belonging to that partition group to one host. Execute this SQL query for all partition groups of the table.
Note that you can only move partition groups, you cannot move single partitions.
3. Merge the partitions - alter table <table_name> merge partitions
4. Run the ABAP report RSDU_TABLE_CONSISTENCY for the table by selecting the check "CL_SCEN_PARTITION_SPEC" first by selecting the "Store" option and then the "Repair" option.
Now you will see the number of partitions in the table has decreased significantly.
Description: Having a bigger row store has multiple disadvantages like – consumption of more memory, increase in database startup time (as the row store is entirely loaded into memory during DB startup). So it’s always beneficial to keep the row store slim and trim.
Row store consists of memory segments 64 MB each. Each of the memory segments further consists of fixed size pages. When a large number of records are deleted from row store tables, it creates empty pages across multiple memory segments. This causes the row store to have a bigger size even though the used space is much less.
Executing this SQL script gives you an output where you can see the amount of space that is fragmented and the fragmentation %.

If the fragmentation % is more than 30, then it’s better to perform a row store reorganization. The reorganization moves all the used pages from the sparse segments into other segments and hence frees up segments which are then released causing reduction in its size.
Action: There are 2 ways to perform row store reorganization – online and offline. SAP recommends to perform offline reorganization to achieve maximum compaction ratio. Refer to OSS note 1813245 - SAP HANA DB: Row store reorganization on how to perform a row store reorganization. Note that online reorganization has been discontinued from HANA 2.0 SPS02.
After running a row store reorganization, it may again get fragmented after few months depending on how much data is getting inserted and deleted. So you should check this at least every 6 months to see of there is significant fragmentation in the row store.
Description: Auto compression should be enabled for all non-BW tables. After every delta merge, the mergedog triggers the compression of the table/table partitions automatically. (However, note that manual execution of delta merge does not trigger compression automatically, you need to do that manually). Now this happens only for tables that have auto compression enabled. So, you can imagine, if you have lots of tables with auto compression disabled, it can not only lead to greater consumption of memory but also disk space and increase backup size as well.
This script gives you the table names that have auto compression disabled and the command to enable it. By default the modification section of this script excludes the BW tables as auto compression is not expected to be enabled for BW tables.

Action: Execute the generated “alter table …” commands to enable auto compression of the tables. For more information, refer to the OSS note 2112604 - FAQ: SAP HANA Compression
Description: All non-BW tables should have auto merge enabled. This will ensure that the delta store does not grow too much as it has performance implications. The delta store contains uncompressed data to speed up insert/update queries. The main store is read optimized. So data from delta store needs to be merged regularly with main store to improve the read performance of the queries and also to reduce memory consumption as tables/table partitions are compressed automatically after a merge operation.
However, note that BW tables use smart merge option which is controlled by the SAP application. There are certain parameters in the mergedog section under indexserver.ini which controls this. Auto merge should not be enabled for BW tables otherwise they may interfere with the smart merge decisions and cause adverse impact.
You can use this SQL script to find out the non-BW tables (by default the modification section of the script excludes BW tables) that have auto merge disabled.

Action: Execute the "Alter table ..." commands from the output of the SQL script to enable auto merge for the non-BW tables. For more information, refer to the OSS note 2057046 - FAQ: SAP HANA Delta Merges
Description: You can use this script to find out the tables that have never been considered for compression optimization. If there are several big tables listed here, it can cause a significant increase in memory consumption of the database.

Action: Execute the update command generated by the script to perform a force compression on the table. You can do this only for big tables and ignore small ones. For e.g. in the above screen shot except the first table, all the other tables are very small in size and need not be considered. For more information, refer to the OSS note 2112604 - FAQ: SAP HANA Compression
Description: This script gives you the list of column store table columns without advanced compression. If there are table columns with more than a million records without compression, it can significantly increase the memory consumption.

Action: Execute the update command from the output of the script to perform compression of those table columns. For more information, refer to the OSS note 2112604 - FAQ: SAP HANA Compression
Description: Row store tables usually consists of a single container, but sometimes more containers can get added, e.g. when adding columns. If multiple containers per row store table is enabled, then adjusting certain table structures like adding columns becomes faster. However it can also introduce problems like performance overhead and terminations.
Using this SQL query you can find out the which row store tables has more than 1 containers. The script also outputs the SQL command to convert the tables into single container tables.

Action: Execute the "Alter table ..." command from the output of the SQL script to convert the multi container tables into single container.
From HANA 2.0 SPS01 adjusting row store tables (like adding columns) will no longer generate multiple containers. Refer to OSS note 2222277 - FAQ: SAP HANA Column Store and Row Store section 22. What are row store containers and which problems can be related to them? for more information.
There are other areas as well that needs to be checked periodically to ensure optimal performance of a HANA system. I will try to write a second part of such health checks that are very easy to follow to maintain your HANA systems' health.
Thanks,
Arindam
As HANA administrators we often think about how to keep a HANA system healthy, what are the things we need to check to ensure that all the things that are necessary for good performance of the system are in place. One way to do that is using the SQL scripts provided by SAP in OSS note 1969700 - SQL Statement Collection for SAP HANA
This OSS note provides a collection of very useful SQL scripts with which you can check a wide range of areas that are critical to a HANA system. In this blog, I will be describing how you can use these scripts to maintain good health of your HANA systems. I would suggest to perform these checks every 6 months.
Note: Some of these SQL scripts are version dependent, so you need to use the one which suits your version.
HANA_Configuration_HybridLOBActivation_CommandGenerator
Description: SAP introduced the concept of hybrid LOBs from SPS07 onwards. Upto SPS06 memory LOBs were used for storing large objects. The disadvantage of memory LOBs was that when any query accessed the columns containing memory LOBs, the entire column along with the LOBs had to be loaded into memory leading to higher memory usage. With hybrid LOBs, the LOB data is only loaded into memory when it's size doesn't exceed a certain configurable threshold (1000 bytes by default), otherwise it resides on disk.
Executing the SQL script “HANA_Configuration_HybridLOBActivation_CommandGenerator” gives you the table name and the column name which has memory LOBs and also the commands to convert them into hybrid LOBs.
Action: Open an SQL console and execute the "Alter table ..." commands from the output of the SQL script. For more information, refer to OSS notes 1994962 - How-To: Activation of Hybrid LOBs in SAP HANA and 2220627 - FAQ: SAP HANA LOBs
HANA_Consistency_TableLOBLocation
Description: This script checks for tables and hybrid LOB containers that are located on different hosts. If they are located on different hosts, it has a significant performance impact as it will increase the network data transfer time, leading to increased time in query execution accessing the LOBs.
From the output of the script you can see the table name, the host in which the table is located and the host in which the LOB containers are located.
Action: You can use this SQL statement to relocate them to the same host.- alter table "<schema_name>"."<table_name>" move to '<target_host>:<target port>' PHYSICAL
Note that the option “physical” is important here. Without the physical option the table data will be moved to the target host excluding the LOB data. Using physical option moves the LOB data as well.
HANA_Disks_Overview
Description: This script gives you the fragmentation information of the data and log files. Usually it’s the data files that gets fragmented over the time so by default the script considers data files only for reporting. In the modification section you can update the PORT as ‘%03” so that only indexserver data files are reported. This is to avoid reporting of data files of other services like scriptserver and xsengine as those are very small in size and defragmenting those will not yield any positive results and is not desired.
Check the column “Fragmentation_Pct”. If the fragmentation percentage is considerable, say more than 40 or 50% then it’s worth doing defragmentation of that data file.
Action: You can execute defragmentation of the data files using the command - Alter system reclaim datavolume ‘<host>:<port>’ 120 defragment
You must take some precautionary measures if you have system replication enabled. You need to ensure that no replication snapshots exist in the system when you are running defragmentation otherwise the defragmentation will fail with the error message “general error: Shrink canceled, probably because of snapshot pages SQLSTATE: HY000”. Refer to OSS note 2332284 - Data volume reclaim failed because of snapshot pages and change the parameters as suggested then perform the defragmentation.
HANA_IO_Commits
Description: You can use this script to check the avg. commit time of the data files for all nodes of your environment.
Action: From the example above, you can see that the avg. commit time for node 13 is too high. With almost the same number of commits, the avg. commit time of node 11 is much less. The main reason is that the I/O time for the indexserver data file of node 13 is higher compared to other nodes hence increasing the commit time. In such scenarios you need to contact your OS team and ask them to check for I/O issues in the persistent layer. Refer to OSS note 1999930 - FAQ: SAP HANA I/O Analysis for more info on I/O analysis.
Also if you have system replication enabled, low thoughput in the system replication network between the primary servers and the secondary servers can increase the commit time on primary significantly, especially if you are using "logreplay" operation mode. You can check the throughput by executing the command hdbcons -e hdbindexserver "replication info" at the OS level of the primary server. Look for the value of "shippedLogBufferThroughput". If the throughput is too low you should contact your OS team and ask them to check the servers on the secondary site. Sometimes hardware issues on the secondary site can decrease the throughput.
The benchmark for avg. commit time is < 10 ms.
HANA_IO_Savepoints
Description: You can run this script by updating the start and end time as per your requirement in the modification section. Also at the bottom of the script I prefer to use the column MAX_BLK_S in the order by clause. This will give you the savepoint statistics of all the nodes within the chosen time period sorted by the max blocking period. You will get a result like below.
The column MAX_BLK_S gives you the blocking period of the savepoints and the column MAX_CRIT_S shows the critical phase duration. From the example above, you can see the blocking phase duration of some of the savepoints is high but the critical phase duration is low.
Savepoint phases can be categorized as below in the order of their occurrence –
Phase 1: Pageflush
Phase 2: Critical phase
Phase 2.1: Blocking phase
Phase 2.2: Critical phase
Phase 3: Post critical
Phase 2 is the most important phase which has severe impact on system performance if that phase takes longer time to complete. During the blocking phase, the system waits for acquiring lock. Once it acquires the lock it then enters the critical phase to write the data into persistence. If either the blocking or the critical phase is too high, it will impact the system performance because no DML operations are permitted in the system during this phase. This manifests in the form of long running sessions and long running threads. All threads performing DML operations like insert, update, delete will get blocked until the lock is released by the savepoint blocking phase. This will lead to severe system slowness.
Action: The blocking phase duration can be high because of bugs in the HANA revisions or some other reasons as well. Check OSS note 2100009 - FAQ: SAP HANA Savepoints, section 6 “How can typical savepoint issues be analyzed and resolved?” and 1999998 - FAQ: SAP HANA Lock Analysis, section 6 “How can internal lock waits be analyzed?”
I have also observed that if you have low throughout in the system replication network between primary and secondary systems, the savepoint blocking phase duration can increase significantly when a full initial load is going on between primary and secondary and also at other times as well. Refer to the section "HANA I/O Commits" above to see how to measure the system replication throughput. So this is another area that you need to check if you are observing high savepoint blocking phase duration very frequently.
If the critical phase duration is high, it is most likely due to I/O issues at the persistence layer. You can check 1999930 - FAQ: SAP HANA I/O Analysis for likely causes and solution. Also you can run the SQL script HANA_Configuration_MiniChecks and refer to the value of savepoint write throughput. It should be > 100 mb/s at least. If this this lesser than 100 mb/s then you should contact your OS/hardware team.
Note that these things change a lot with new HANA revisions so you should watch the latest version of the above-mentioned OSS notes to get updated information. For e.g. consistent change lock is not acquired anymore during the blocking phase from SPS11 onwards.
HANA_Logs_LogBuffers
Description: Ececuting this script shows you the log buffer wait count ratio and the log buffer race count ratio. Both should not be more than 1. In the example below you can see the log switch wait count ratio is little high for node 17.
Action: There can be several ways to investigate this. You can increase the log buffer size and/or number of log buffers. Refer to OSS note 2215131 - Alert Log Switch Wait Count Ratio. Note the caution mentioned in the note on the side effect of increasing the log buffer size too much.
There can also be I/O issues at the hardware level which may slow down the write speed from log buffers to persistence hence increasing the wait time for log buffer switch. You can download the hardware configuration check tool from OSS note 1943937 - Hardware Configuration Check Tool - Central Note and compare the throughput of your system with the benchmark provided in the pdf document attached to the note.
Another reason can be sub-optimal distribution of data if you are using a scaled-out landscape. If the load on some servers are too high compared to other nodes, it may lead to a high log buffer wait count ratio on those nodes. You can perform a table redistribution operation to ensure that tables are optimally distributed across all nodes so that only few nodes are not overloaded.
HANA_Tables_ColumnStore_PartitionedTables
Description: You can use this script to check the partitioning details of all tables. You can update the parameter "MIN_NUM_PARTITIONS" to 100 in the modification section of the script so that the output of the script shows only those tables that has more than 100 partitions. Having too many partitions can cause adverse performance impact as any query which is not using the partitioning column in their where clause will have to scan all the partitions. Also there is a limit on the maximum number of partitions allowed for one table, 1000 till SPS09 and 16000 from SPS10 onwards. So you need to keep a watch on the tables having the highest number of partitions.
Action: 1. First you need to find out the hosts where all the partitions reside. From HANA studio under the system, right click on the "catalog" and click on find table. Enter the table name and go to the "Runtime information" tab. At the bottom section "Details for table" under the sub-section "Parts" you can see the hosts where the partitions reside. See screen shot below.
From here you can see the table has 6 partition groups each partition groups having several partitions each.
2. Execute the SQL query - alter table <table_name> move partition <partition group no.> to '<host>:<port>', where partition group no is the number that you see on the left half of the screen shot above, to move all the partitions belonging to that partition group to one host. Execute this SQL query for all partition groups of the table.
Note that you can only move partition groups, you cannot move single partitions.
3. Merge the partitions - alter table <table_name> merge partitions
4. Run the ABAP report RSDU_TABLE_CONSISTENCY for the table by selecting the check "CL_SCEN_PARTITION_SPEC" first by selecting the "Store" option and then the "Repair" option.
Now you will see the number of partitions in the table has decreased significantly.
HANA_RowStore_Overview
Description: Having a bigger row store has multiple disadvantages like – consumption of more memory, increase in database startup time (as the row store is entirely loaded into memory during DB startup). So it’s always beneficial to keep the row store slim and trim.
Row store consists of memory segments 64 MB each. Each of the memory segments further consists of fixed size pages. When a large number of records are deleted from row store tables, it creates empty pages across multiple memory segments. This causes the row store to have a bigger size even though the used space is much less.
Executing this SQL script gives you an output where you can see the amount of space that is fragmented and the fragmentation %.
If the fragmentation % is more than 30, then it’s better to perform a row store reorganization. The reorganization moves all the used pages from the sparse segments into other segments and hence frees up segments which are then released causing reduction in its size.
Action: There are 2 ways to perform row store reorganization – online and offline. SAP recommends to perform offline reorganization to achieve maximum compaction ratio. Refer to OSS note 1813245 - SAP HANA DB: Row store reorganization on how to perform a row store reorganization. Note that online reorganization has been discontinued from HANA 2.0 SPS02.
After running a row store reorganization, it may again get fragmented after few months depending on how much data is getting inserted and deleted. So you should check this at least every 6 months to see of there is significant fragmentation in the row store.
HANA_Tables_ColumnStore_AutoCompressionDisabled
Description: Auto compression should be enabled for all non-BW tables. After every delta merge, the mergedog triggers the compression of the table/table partitions automatically. (However, note that manual execution of delta merge does not trigger compression automatically, you need to do that manually). Now this happens only for tables that have auto compression enabled. So, you can imagine, if you have lots of tables with auto compression disabled, it can not only lead to greater consumption of memory but also disk space and increase backup size as well.
This script gives you the table names that have auto compression disabled and the command to enable it. By default the modification section of this script excludes the BW tables as auto compression is not expected to be enabled for BW tables.
Action: Execute the generated “alter table …” commands to enable auto compression of the tables. For more information, refer to the OSS note 2112604 - FAQ: SAP HANA Compression
HANA_Tables_ColumnStore_AutoMergeDisabled
Description: All non-BW tables should have auto merge enabled. This will ensure that the delta store does not grow too much as it has performance implications. The delta store contains uncompressed data to speed up insert/update queries. The main store is read optimized. So data from delta store needs to be merged regularly with main store to improve the read performance of the queries and also to reduce memory consumption as tables/table partitions are compressed automatically after a merge operation.
However, note that BW tables use smart merge option which is controlled by the SAP application. There are certain parameters in the mergedog section under indexserver.ini which controls this. Auto merge should not be enabled for BW tables otherwise they may interfere with the smart merge decisions and cause adverse impact.
You can use this SQL script to find out the non-BW tables (by default the modification section of the script excludes BW tables) that have auto merge disabled.
Action: Execute the "Alter table ..." commands from the output of the SQL script to enable auto merge for the non-BW tables. For more information, refer to the OSS note 2057046 - FAQ: SAP HANA Delta Merges
HANA_Tables_ColumnStore_TablesWithoutCompressionOptimization
Description: You can use this script to find out the tables that have never been considered for compression optimization. If there are several big tables listed here, it can cause a significant increase in memory consumption of the database.
Action: Execute the update command generated by the script to perform a force compression on the table. You can do this only for big tables and ignore small ones. For e.g. in the above screen shot except the first table, all the other tables are very small in size and need not be considered. For more information, refer to the OSS note 2112604 - FAQ: SAP HANA Compression
HANA_Tables_ColumnStore_ColumnsWithoutCompressionOptimization
Description: This script gives you the list of column store table columns without advanced compression. If there are table columns with more than a million records without compression, it can significantly increase the memory consumption.
Action: Execute the update command from the output of the script to perform compression of those table columns. For more information, refer to the OSS note 2112604 - FAQ: SAP HANA Compression
HANA_Tables_RowStore_TablesWithMultipleContainers_1.00.90+
Description: Row store tables usually consists of a single container, but sometimes more containers can get added, e.g. when adding columns. If multiple containers per row store table is enabled, then adjusting certain table structures like adding columns becomes faster. However it can also introduce problems like performance overhead and terminations.
Using this SQL query you can find out the which row store tables has more than 1 containers. The script also outputs the SQL command to convert the tables into single container tables.
Action: Execute the "Alter table ..." command from the output of the SQL script to convert the multi container tables into single container.
From HANA 2.0 SPS01 adjusting row store tables (like adding columns) will no longer generate multiple containers. Refer to OSS note 2222277 - FAQ: SAP HANA Column Store and Row Store section 22. What are row store containers and which problems can be related to them? for more information.
There are other areas as well that needs to be checked periodically to ensure optimal performance of a HANA system. I will try to write a second part of such health checks that are very easy to follow to maintain your HANA systems' health.
Thanks,
Arindam
- SAP Managed Tags:
- SAP HANA
You must be a registered user to add a comment. If you've already registered, sign in. Otherwise, register and sign in.
Labels in this area
-
"automatische backups"
1 -
"regelmäßige sicherung"
1 -
"TypeScript" "Development" "FeedBack"
1 -
505 Technology Updates 53
1 -
ABAP
14 -
ABAP API
1 -
ABAP CDS Views
2 -
ABAP CDS Views - BW Extraction
1 -
ABAP CDS Views - CDC (Change Data Capture)
1 -
ABAP class
2 -
ABAP Cloud
2 -
ABAP Development
5 -
ABAP in Eclipse
1 -
ABAP Platform Trial
1 -
ABAP Programming
2 -
abap technical
1 -
absl
2 -
access data from SAP Datasphere directly from Snowflake
1 -
Access data from SAP datasphere to Qliksense
1 -
Accrual
1 -
action
1 -
adapter modules
1 -
Addon
1 -
Adobe Document Services
1 -
ADS
1 -
ADS Config
1 -
ADS with ABAP
1 -
ADS with Java
1 -
ADT
2 -
Advance Shipping and Receiving
1 -
Advanced Event Mesh
3 -
AEM
1 -
AI
7 -
AI Launchpad
1 -
AI Projects
1 -
AIML
9 -
Alert in Sap analytical cloud
1 -
Amazon S3
1 -
Analytical Dataset
1 -
Analytical Model
1 -
Analytics
1 -
Analyze Workload Data
1 -
annotations
1 -
API
1 -
API and Integration
3 -
API Call
2 -
API security
1 -
Application Architecture
1 -
Application Development
5 -
Application Development for SAP HANA Cloud
3 -
Applications and Business Processes (AP)
1 -
Artificial Intelligence
1 -
Artificial Intelligence (AI)
5 -
Artificial Intelligence (AI) 1 Business Trends 363 Business Trends 8 Digital Transformation with Cloud ERP (DT) 1 Event Information 462 Event Information 15 Expert Insights 114 Expert Insights 76 Life at SAP 418 Life at SAP 1 Product Updates 4
1 -
Artificial Intelligence (AI) blockchain Data & Analytics
1 -
Artificial Intelligence (AI) blockchain Data & Analytics Intelligent Enterprise
1 -
Artificial Intelligence (AI) blockchain Data & Analytics Intelligent Enterprise Oil Gas IoT Exploration Production
1 -
Artificial Intelligence (AI) blockchain Data & Analytics Intelligent Enterprise sustainability responsibility esg social compliance cybersecurity risk
1 -
ASE
1 -
ASR
2 -
ASUG
1 -
Attachments
1 -
Authorisations
1 -
Automating Processes
1 -
Automation
2 -
aws
2 -
Azure
1 -
Azure AI Studio
1 -
Azure API Center
1 -
Azure API Management
1 -
B2B Integration
1 -
Backorder Processing
1 -
Backup
1 -
Backup and Recovery
1 -
Backup schedule
1 -
BADI_MATERIAL_CHECK error message
1 -
Bank
1 -
BAS
1 -
basis
2 -
Basis Monitoring & Tcodes with Key notes
2 -
Batch Management
1 -
BDC
1 -
Best Practice
1 -
bitcoin
1 -
Blockchain
3 -
bodl
1 -
BOP in aATP
1 -
BOP Segments
1 -
BOP Strategies
1 -
BOP Variant
1 -
BPC
1 -
BPC LIVE
1 -
BTP
12 -
BTP Destination
2 -
Business AI
1 -
Business and IT Integration
1 -
Business application stu
1 -
Business Application Studio
1 -
Business Architecture
1 -
Business Communication Services
1 -
Business Continuity
1 -
Business Data Fabric
3 -
Business Partner
12 -
Business Partner Master Data
10 -
Business Technology Platform
2 -
Business Trends
4 -
CA
1 -
calculation view
1 -
CAP
4 -
Capgemini
1 -
CAPM
1 -
Catalyst for Efficiency: Revolutionizing SAP Integration Suite with Artificial Intelligence (AI) and
1 -
CCMS
2 -
CDQ
12 -
CDS
2 -
Cental Finance
1 -
Certificates
1 -
CFL
1 -
Change Management
1 -
chatbot
1 -
chatgpt
3 -
CL_SALV_TABLE
2 -
Class Runner
1 -
Classrunner
1 -
Cloud ALM Monitoring
1 -
Cloud ALM Operations
1 -
cloud connector
1 -
Cloud Extensibility
1 -
Cloud Foundry
4 -
Cloud Integration
6 -
Cloud Platform Integration
2 -
cloudalm
1 -
communication
1 -
Compensation Information Management
1 -
Compensation Management
1 -
Compliance
1 -
Compound Employee API
1 -
Configuration
1 -
Connectors
1 -
Consolidation Extension for SAP Analytics Cloud
2 -
Control Indicators.
1 -
Controller-Service-Repository pattern
1 -
Conversion
1 -
Cosine similarity
1 -
cryptocurrency
1 -
CSI
1 -
ctms
1 -
Custom chatbot
3 -
Custom Destination Service
1 -
custom fields
1 -
Customer Experience
1 -
Customer Journey
1 -
Customizing
1 -
cyber security
3 -
cybersecurity
1 -
Data
1 -
Data & Analytics
1 -
Data Aging
1 -
Data Analytics
2 -
Data and Analytics (DA)
1 -
Data Archiving
1 -
Data Back-up
1 -
Data Flow
1 -
Data Governance
5 -
Data Integration
2 -
Data Quality
12 -
Data Quality Management
12 -
Data Synchronization
1 -
data transfer
1 -
Data Unleashed
1 -
Data Value
8 -
database tables
1 -
Datasphere
3 -
datenbanksicherung
1 -
dba cockpit
1 -
dbacockpit
1 -
Debugging
2 -
Defender
1 -
Delimiting Pay Components
1 -
Delta Integrations
1 -
Destination
3 -
Destination Service
1 -
Developer extensibility
1 -
Developing with SAP Integration Suite
1 -
Devops
1 -
digital transformation
1 -
Documentation
1 -
Dot Product
1 -
DQM
1 -
dump database
1 -
dump transaction
1 -
e-Invoice
1 -
E4H Conversion
1 -
Eclipse ADT ABAP Development Tools
2 -
edoc
1 -
edocument
1 -
ELA
1 -
Embedded Consolidation
1 -
Embedding
1 -
Embeddings
1 -
Employee Central
1 -
Employee Central Payroll
1 -
Employee Central Time Off
1 -
Employee Information
1 -
Employee Rehires
1 -
Enable Now
1 -
Enable now manager
1 -
endpoint
1 -
Enhancement Request
1 -
Enterprise Architecture
1 -
ESLint
1 -
ETL Business Analytics with SAP Signavio
1 -
Euclidean distance
1 -
Event Dates
1 -
Event Driven Architecture
1 -
Event Mesh
2 -
Event Reason
1 -
EventBasedIntegration
1 -
EWM
1 -
EWM Outbound configuration
1 -
EWM-TM-Integration
1 -
Existing Event Changes
1 -
Expand
1 -
Expert
2 -
Expert Insights
2 -
Exploits
1 -
Fiori
14 -
Fiori Elements
2 -
Fiori SAPUI5
12 -
Flask
1 -
Full Stack
8 -
Funds Management
1 -
General
1 -
General Splitter
1 -
Generative AI
1 -
Getting Started
1 -
GitHub
8 -
Grants Management
1 -
GraphQL
1 -
groovy
1 -
GTP
1 -
HANA
6 -
HANA Cloud
2 -
Hana Cloud Database Integration
2 -
HANA DB
2 -
HANA XS Advanced
1 -
Historical Events
1 -
home labs
1 -
HowTo
1 -
HR Data Management
1 -
html5
8 -
HTML5 Application
1 -
Identity cards validation
1 -
idm
1 -
Implementation
1 -
input parameter
1 -
instant payments
1 -
Integration
3 -
Integration Advisor
1 -
Integration Architecture
1 -
Integration Center
1 -
Integration Suite
1 -
intelligent enterprise
1 -
iot
1 -
Java
1 -
job
1 -
Job Information Changes
1 -
Job-Related Events
1 -
Job_Event_Information
1 -
joule
4 -
Journal Entries
1 -
Just Ask
1 -
Kerberos for ABAP
8 -
Kerberos for JAVA
8 -
KNN
1 -
Launch Wizard
1 -
Learning Content
2 -
Life at SAP
5 -
lightning
1 -
Linear Regression SAP HANA Cloud
1 -
Loading Indicator
1 -
local tax regulations
1 -
LP
1 -
Machine Learning
2 -
Marketing
1 -
Master Data
3 -
Master Data Management
14 -
Maxdb
2 -
MDG
1 -
MDGM
1 -
MDM
1 -
Message box.
1 -
Messages on RF Device
1 -
Microservices Architecture
1 -
Microsoft Universal Print
1 -
Middleware Solutions
1 -
Migration
5 -
ML Model Development
1 -
Modeling in SAP HANA Cloud
8 -
Monitoring
3 -
MTA
1 -
Multi-Record Scenarios
1 -
Multiple Event Triggers
1 -
Myself Transformation
1 -
Neo
1 -
New Event Creation
1 -
New Feature
1 -
Newcomer
1 -
NodeJS
3 -
ODATA
2 -
OData APIs
1 -
odatav2
1 -
ODATAV4
1 -
ODBC
1 -
ODBC Connection
1 -
Onpremise
1 -
open source
2 -
OpenAI API
1 -
Oracle
1 -
PaPM
1 -
PaPM Dynamic Data Copy through Writer function
1 -
PaPM Remote Call
1 -
PAS-C01
1 -
Pay Component Management
1 -
PGP
1 -
Pickle
1 -
PLANNING ARCHITECTURE
1 -
Popup in Sap analytical cloud
1 -
PostgrSQL
1 -
POSTMAN
1 -
Prettier
1 -
Process Automation
2 -
Product Updates
4 -
PSM
1 -
Public Cloud
1 -
Python
4 -
python library - Document information extraction service
1 -
Qlik
1 -
Qualtrics
1 -
RAP
3 -
RAP BO
2 -
Record Deletion
1 -
Recovery
1 -
recurring payments
1 -
redeply
1 -
Release
1 -
Remote Consumption Model
1 -
Replication Flows
1 -
research
1 -
Resilience
1 -
REST
1 -
REST API
2 -
Retagging Required
1 -
Risk
1 -
Rolling Kernel Switch
1 -
route
1 -
rules
1 -
S4 HANA
1 -
S4 HANA Cloud
1 -
S4 HANA On-Premise
1 -
S4HANA
3 -
S4HANA_OP_2023
2 -
SAC
10 -
SAC PLANNING
9 -
SAP
4 -
SAP ABAP
1 -
SAP Advanced Event Mesh
1 -
SAP AI Core
8 -
SAP AI Launchpad
8 -
SAP Analytic Cloud Compass
1 -
Sap Analytical Cloud
1 -
SAP Analytics Cloud
4 -
SAP Analytics Cloud for Consolidation
3 -
SAP Analytics Cloud Story
1 -
SAP analytics clouds
1 -
SAP API Management
1 -
SAP BAS
1 -
SAP Basis
6 -
SAP BODS
1 -
SAP BODS certification.
1 -
SAP BTP
21 -
SAP BTP Build Work Zone
2 -
SAP BTP Cloud Foundry
6 -
SAP BTP Costing
1 -
SAP BTP CTMS
1 -
SAP BTP Innovation
1 -
SAP BTP Migration Tool
1 -
SAP BTP SDK IOS
1 -
SAP Build
11 -
SAP Build App
1 -
SAP Build apps
1 -
SAP Build CodeJam
1 -
SAP Build Process Automation
3 -
SAP Build work zone
10 -
SAP Business Objects Platform
1 -
SAP Business Technology
2 -
SAP Business Technology Platform (XP)
1 -
sap bw
1 -
SAP CAP
2 -
SAP CDC
1 -
SAP CDP
1 -
SAP CDS VIEW
1 -
SAP Certification
1 -
SAP Cloud ALM
4 -
SAP Cloud Application Programming Model
1 -
SAP Cloud Integration for Data Services
1 -
SAP cloud platform
8 -
SAP Companion
1 -
SAP CPI
3 -
SAP CPI (Cloud Platform Integration)
2 -
SAP CPI Discover tab
1 -
sap credential store
1 -
SAP Customer Data Cloud
1 -
SAP Customer Data Platform
1 -
SAP Data Intelligence
1 -
SAP Data Migration in Retail Industry
1 -
SAP Data Services
1 -
SAP DATABASE
1 -
SAP Dataspher to Non SAP BI tools
1 -
SAP Datasphere
9 -
SAP DRC
1 -
SAP EWM
1 -
SAP Fiori
3 -
SAP Fiori App Embedding
1 -
Sap Fiori Extension Project Using BAS
1 -
SAP GRC
1 -
SAP HANA
1 -
SAP HCM (Human Capital Management)
1 -
SAP HR Solutions
1 -
SAP IDM
1 -
SAP Integration Suite
9 -
SAP Integrations
4 -
SAP iRPA
2 -
SAP LAGGING AND SLOW
1 -
SAP Learning Class
1 -
SAP Learning Hub
1 -
SAP Master Data
1 -
SAP Odata
2 -
SAP on Azure
2 -
SAP PartnerEdge
1 -
sap partners
1 -
SAP Password Reset
1 -
SAP PO Migration
1 -
SAP Prepackaged Content
1 -
SAP Process Automation
2 -
SAP Process Integration
2 -
SAP Process Orchestration
1 -
SAP S4HANA
2 -
SAP S4HANA Cloud
1 -
SAP S4HANA Cloud for Finance
1 -
SAP S4HANA Cloud private edition
1 -
SAP Sandbox
1 -
SAP STMS
1 -
SAP successfactors
3 -
SAP SuccessFactors HXM Core
1 -
SAP Time
1 -
SAP TM
2 -
SAP Trading Partner Management
1 -
SAP UI5
1 -
SAP Upgrade
1 -
SAP Utilities
1 -
SAP-GUI
8 -
SAP_COM_0276
1 -
SAPBTP
1 -
SAPCPI
1 -
SAPEWM
1 -
sapmentors
1 -
saponaws
2 -
SAPS4HANA
1 -
SAPUI5
5 -
schedule
1 -
Script Operator
1 -
Secure Login Client Setup
8 -
security
9 -
Selenium Testing
1 -
Self Transformation
1 -
Self-Transformation
1 -
SEN
1 -
SEN Manager
1 -
service
1 -
SET_CELL_TYPE
1 -
SET_CELL_TYPE_COLUMN
1 -
SFTP scenario
2 -
Simplex
1 -
Single Sign On
8 -
Singlesource
1 -
SKLearn
1 -
Slow loading
1 -
soap
1 -
Software Development
1 -
SOLMAN
1 -
solman 7.2
2 -
Solution Manager
3 -
sp_dumpdb
1 -
sp_dumptrans
1 -
SQL
1 -
sql script
1 -
SSL
8 -
SSO
8 -
Substring function
1 -
SuccessFactors
1 -
SuccessFactors Platform
1 -
SuccessFactors Time Tracking
1 -
Sybase
1 -
system copy method
1 -
System owner
1 -
Table splitting
1 -
Tax Integration
1 -
Technical article
1 -
Technical articles
1 -
Technology Updates
14 -
Technology Updates
1 -
Technology_Updates
1 -
terraform
1 -
Threats
2 -
Time Collectors
1 -
Time Off
2 -
Time Sheet
1 -
Time Sheet SAP SuccessFactors Time Tracking
1 -
Tips and tricks
2 -
toggle button
1 -
Tools
1 -
Trainings & Certifications
1 -
Transformation Flow
1 -
Transport in SAP BODS
1 -
Transport Management
1 -
TypeScript
3 -
ui designer
1 -
unbind
1 -
Unified Customer Profile
1 -
UPB
1 -
Use of Parameters for Data Copy in PaPM
1 -
User Unlock
1 -
VA02
1 -
Validations
1 -
Vector Database
2 -
Vector Engine
1 -
Visual Studio Code
1 -
VSCode
2 -
VSCode extenions
1 -
Vulnerabilities
1 -
Web SDK
1 -
work zone
1 -
workload
1 -
xsa
1 -
XSA Refresh
1
- « Previous
- Next »
Related Content
- SAP Build Process Automation Pre-built content for Finance Use cases in Technology Blogs by SAP
- IoT - Ultimate Data Cyber Security - with Enterprise Blockchain and SAP BTP 🚀 in Technology Blogs by Members
- ABAP Cloud Developer Trial 2022 Available Now in Technology Blogs by SAP
- When to Use Multi-Off in 3SL in Technology Blogs by SAP
- Capture Your Own Workload Statistics in the ABAP Environment in the Cloud in Technology Blogs by SAP
Top kudoed authors
| User | Count |
|---|---|
| 8 | |
| 5 | |
| 5 | |
| 4 | |
| 4 | |
| 4 | |
| 3 | |
| 3 | |
| 3 | |
| 3 |