Last time, we took a high-level view of composites in Lumira 2.0 Designer. Now we’ll construct a basic, reusable composite. It will be a chart, which brings its data connection along for the ride. Perhaps you re-use connections to certain data sources over and over in your apps, in which case something like this is a time saver. In principle, you could add a chart picker, filter component into the composite for a ready-made, reusable data source specific analytic widget. For our purposes, however, we’ll keep it simple and limited to just the chart and data connection.
Overview
- We’ll start in Discovery, acquire a dataset and save the .lumx file. We’ll use the BestRunCorpretail.xlsx demo dataset that ships with Lumira 2.0.
- In Designer, we’ll create a simple composite.
- In Designer, we’ll create a basic app and use this composite.
Preparation
Open Discovery.
In the Data Source menu of the Home screen, click on Microsoft Excel.

Select the file BestRunCorpretail.xlsx.

Save the file as CompositesBlog. (If you want, you can skip this section and just use the lumx file attached to this post).
You are done with Discovery. You can close it now.
Create a Simple Composite
Open Designer.
In the documents Panel, open the document that you created in Discovery (or downloaded).
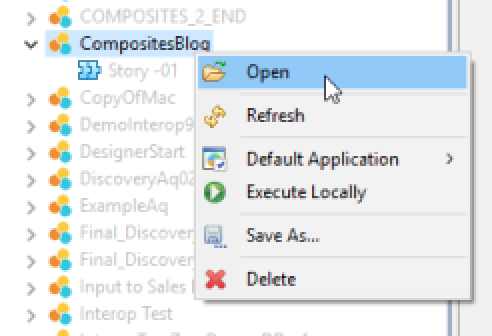
Right click on the document and select Create Composite.

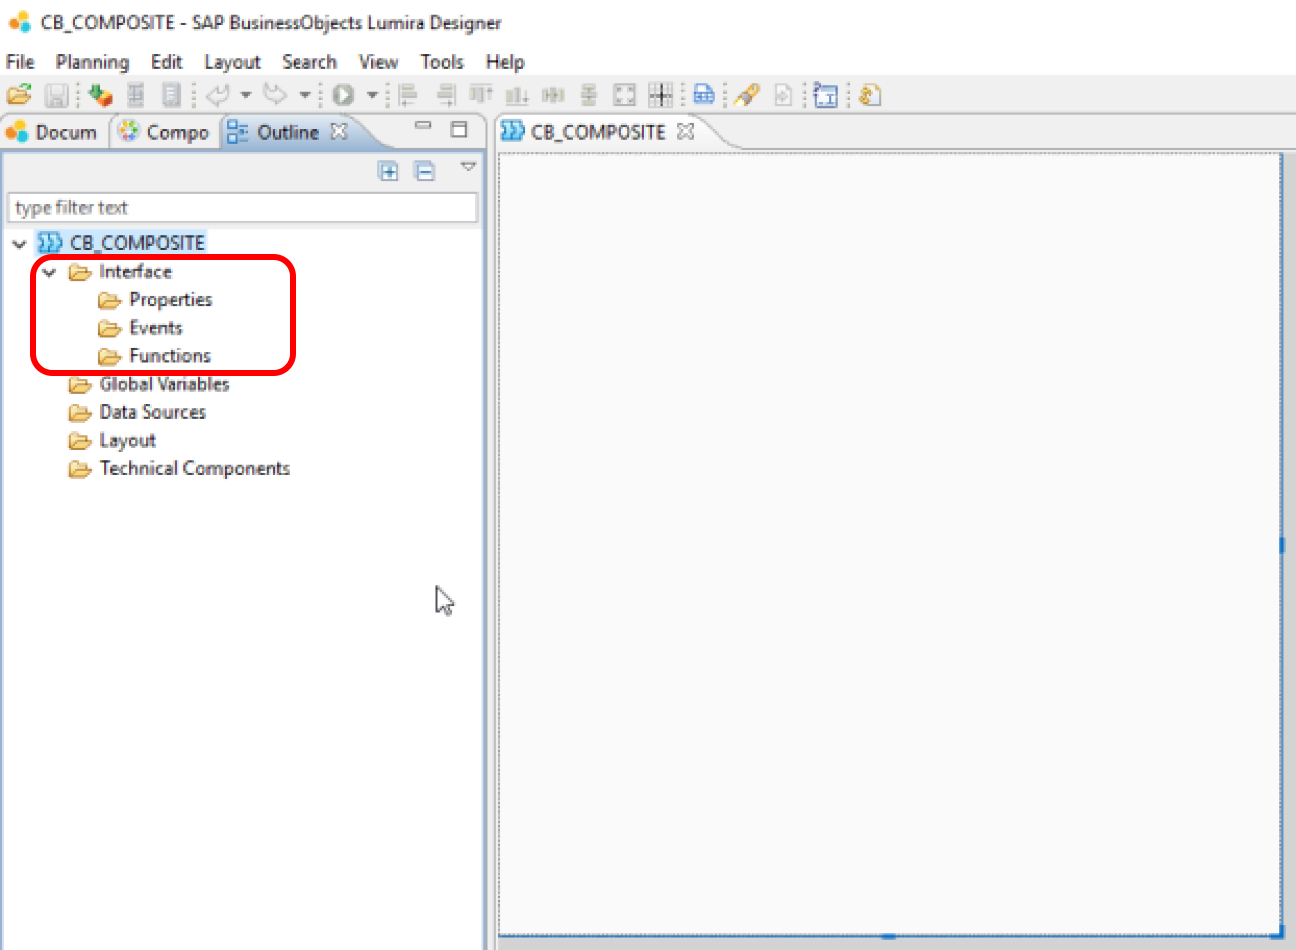
Give it the name CB_COMPOSITE

Have a look at the empty composite layout in the Outline pane. You’ll notice that it differs from an app in one significant way. There is a block in the outline tree, with a root node named Interface. We’ll come back to this in the next installment. For now, we’ll concentrate on the basics.
Right Click on Data Sources and add an offline data source.

Select the acquired Best Run demo dataset. (This is why you started in Discovery and acquired the dataset)

Add a chart. Maximize it to make it fill the composite canvas. Assign this data source, but do not make any data selections.


Save the composite. You are ready to try it out.
Use the Composite
In the documents Panel, right click on the document and select Create Application.

Select the Blank template and name the app CB_APP

From the composites panel of the components pane, drag CB_COMPOSITE into the canvas. Click on the maximize button to make it fill the app canvas.

Save it and execute it. You now have you’re a working composite and are using it in an app.

 Next time
, we’ll dive deeper into the Interface tree of the outline.
