Insight at your fingertips on the SAP Business Rei...
Technology Blogs by SAP
Learn how to extend and personalize SAP applications. Follow the SAP technology blog for insights into SAP BTP, ABAP, SAP Analytics Cloud, SAP HANA, and more.
The Digital Boardroom demo we walked through on the SAP Business Reimagined Tour was a shortened version a standard Digital Boardroom demo where we work with JF Technology. JF Technology is a fictional, small, technology company, based out of Vancouver, Canada. I’ll lay out a high-level overview of my talk track so you can get a better understanding of what someone would see when walking through the SAP Business Reimagined Tour.
A Digital Boardroom installation typically includes three, large, touch-screen monitors, each displaying different content. I would start off by explaining each of the different screens, from left to right, to the audience.
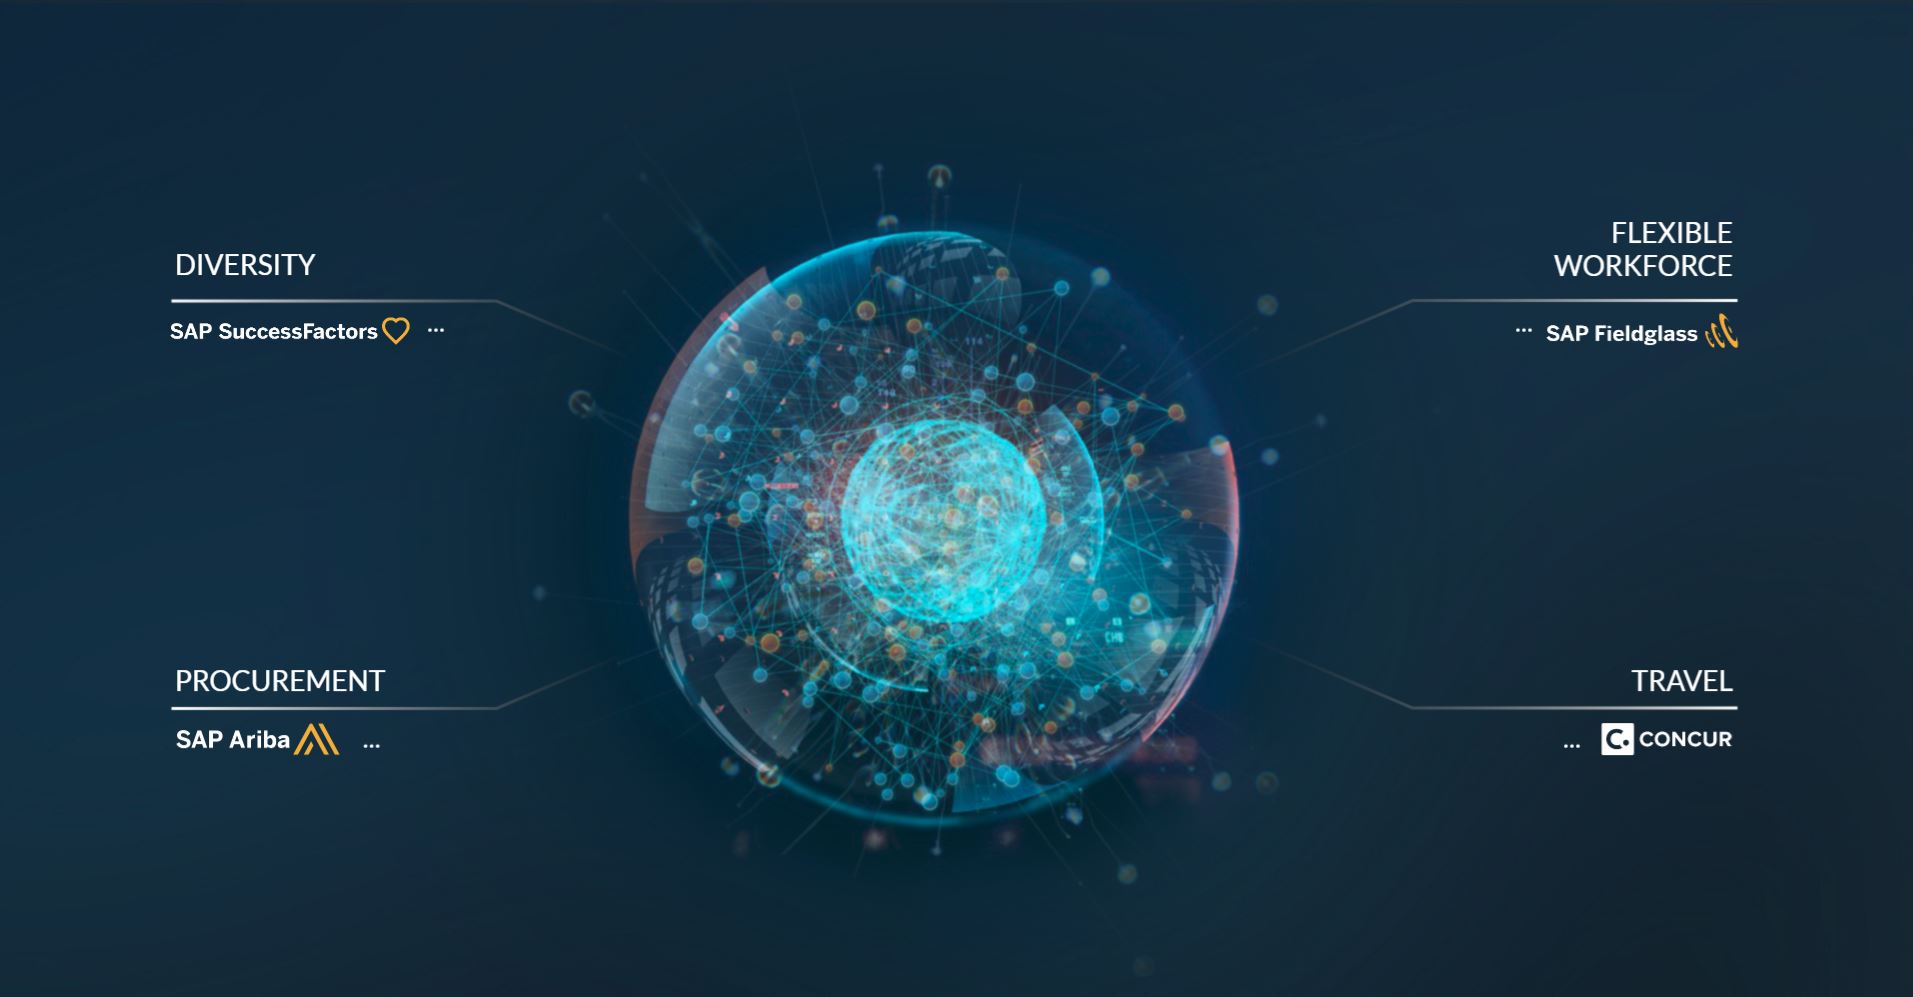
Left Screen - Company Overview:
Middle Screen - Content or Agenda Screen:
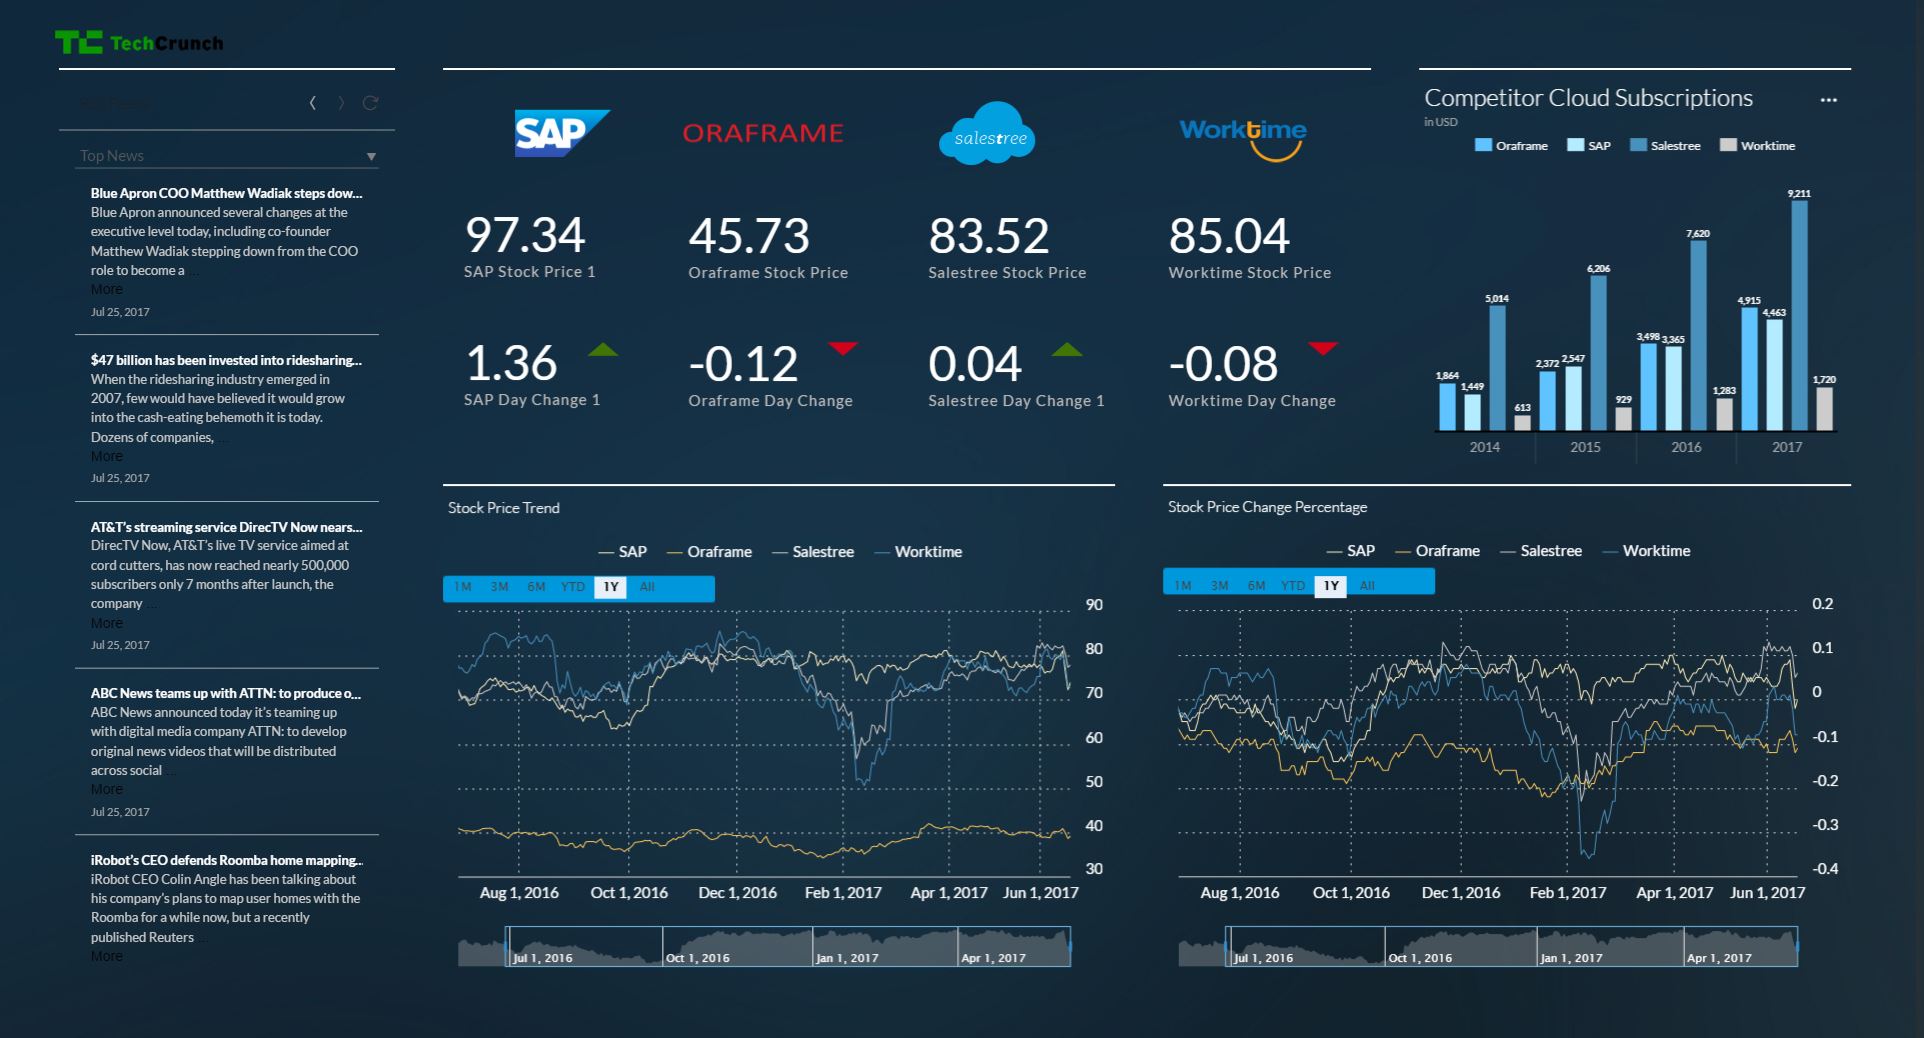
Right Screen - Context Screen:
I would then move into a Procurement Dashboard from the Content (Middle) screen, and discuss how these would be the most important metrics I, the Head of Procurement for JF Technology, would want to keep an eye on.
Next I would open “Spend by Contract vs. Non-contract” in Explorer mode. This shows the audience all of the procurement spend and categorizes it by the different departments in JF Technology: Sales, Product, and Development. Next, I would drill down further into Sales to display all of the employees that roll-up to the Sales department, and show their individual spend, still split by Contract Spend and Non-Contract spend. This also shows one employee, Joe Anderson, with an unusually high amount of Non-contract spend. With this newly found information the Head of Procurement can take action to fix this issue.
Key Points of Discussion during the demo:
Organizations can bring in their SAP data, Non-SAP data, internal information, external information, etc. This is important because not every organization runs their entire organization on SAP software, and we recognize this. So having the ability to pull in all of this data, from multiple sources, is going to give organizations a complete view of how they are truly performing.
This is one example of the look and feel of the Digital Boardroom, the tool in SAP Analytics Cloud to build out the Digital Boardroom User Experience is incredibly intuitive and easy for non-technical users to pick up.
Common Customer Questions:
Q: “How do I read this middle screen?”
A: This screen is briefly explained during the intro of the three screens, but occasionally the audience wants a deeper description. I would explain that this screen is how we would jump into different detailed Line of Business dashboards, we just looked at one with Procurement. Something else to point out is that this is just one example of how your “Content” or “Agenda” screen can look in the Digital Boardroom. We met with a large agriculture company while on the Business Reimagined Tour, they were using the Digital Boardroom to pull in all the data necessary to run 6 Common Business Scenarios, one of which was closing their books at the end of the quarter.
Q: “What do I need to run this?”
A: The SAP Digital Boardroom sits on top of SAP Analytics Cloud. Customers need SAP Analytics Cloud to run the Digital Boardroom, but they can run SAP Analytics Cloud without using the Digital Boardroom if interested. Both are Software as a Service offerings.
To see a short intro video the Digital Boardroom, watch the video below:
To see more in-depth videos around various Solutions shown on the SAP Business Reimagined Tour, follow the link below!