This is a blog within a series of best practices blogs for cloud integration content in SAP Process Orchestration. For an overview of all blogs published within this series so far, refer to the
overview blog.
The following blog shows how to monitor the message exchange on SAP Process Orchestration for SAP Cloud Platform Integration content running on SAP Process Orchestration.
Message monitor
Open the Process Integration Tools overview page via http(s)://host:port/dir, and select the link Configuration and Monitoring Home. You can access the Configuration and Monitoring Home page also directly via http(s)://host:port/pimon.

Switch to tab Adapter Engine below Monitoring, and select link Message Monitor.

In the message monitor, switch to tab Cloud integration Content. This provides you with the Message Processing Log (MPL) of all messages exchanged on the cloud integration runtime of SAP Process Orchestration.

Context sensitive navigation to message monitor
You can also navigate to the message monitor from within the Cloud Integration Content Management cockpit. Open the cockpit via url http(s)://host:port/IGWGBDeploy/Admin. Select an integration flow, mouse over the deployed integration flow, and select View MPL from the context menu.
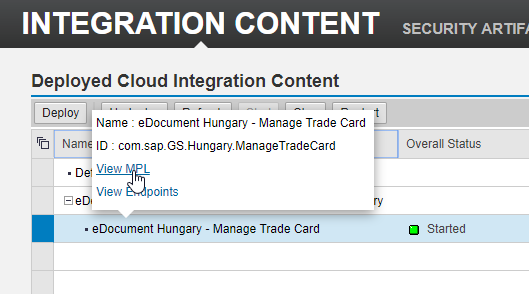
This opens the message monitor like above. Only the messages related to the selected integration flow are displayed.
Alerting
As of SAP Process Orchestration 7.5 SP09, the component-based message alerting also works for the cloud integration content runtime, see SAP note
2437877. With 7.5 SP10, further enhancements have been shipped, see SAP note
247895. Also note that with the latest shipment, the SAP UI5 scheme has been changed.
In the deployment cockpit, select an integration flow. From the context menu, you can navigate to the alert rules by selecting the Create/View Alert Rule link.

This opens the message alert configuration. If you haven't created an alert rule for the particular integration flow yet, a new alert rule will be automatically created. Otherwise, if an alert rule already exists filtering on the very same integration flow, the corresponding alert rule will be displayed.

By default, the email alert consumer is assigned to the alert rule. In case of a runtime issue, an alert is triggered, and an email notification will be sent. Prerequisite is that the email consumer job has been scheduled. You can also change the automatically created alert rule afterwards, e.g., you may use SAP Solution Manager as consumer instead of the email alert consumer. or you may change severity or suppress interval.
The alerting capabilities are actually the same as for the component-based message alerting for the Process Integration runtime. For more details, refer to the documentation at
help.sap.com.
Component monitoring
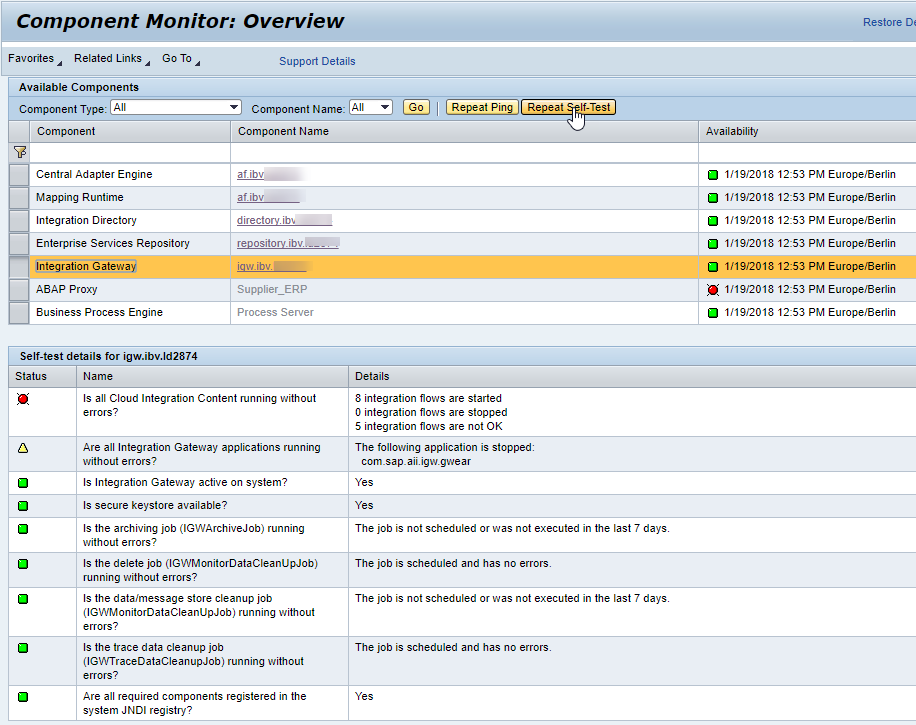
To check whether the cloud integration content runtime component works properly, it has been included in the component monitor. From the monitoring home page, you can navigate to the component monitor.

In the component monitor, select the component Integration Gateway. This is actually the technical name of the cloud integration content runtime component. From here you can carry out a ping or run the self test. A couple of self tests are carried out such as checking the registration status, checking the various background jobs, checking the status of the deployed integration content, etc. See also SAP note
2515627.