
- SAP Community
- Products and Technology
- Technology
- Technology Blogs by SAP
- What’s New in SAP Analytics Cloud and SAP Digital ...
Technology Blogs by SAP
Learn how to extend and personalize SAP applications. Follow the SAP technology blog for insights into SAP BTP, ABAP, SAP Analytics Cloud, SAP HANA, and more.
Turn on suggestions
Auto-suggest helps you quickly narrow down your search results by suggesting possible matches as you type.
Showing results for
cchoy
Participant
Options
- Subscribe to RSS Feed
- Mark as New
- Mark as Read
- Bookmark
- Subscribe
- Printer Friendly Page
- Report Inappropriate Content
07-29-2017
5:31 AM
This blog covers some of the latest new features and enhancements in SAP Analytics Cloud* and SAP Digital Boardroom release 2017.14. Please note that the Analytics Cloud Help documentation is updated at the same time as the upgrade to this release, so the links here may not yet reflect what is described below until after the upgrade is complete.
SAP Analytics Cloud agent version required for data acquisition with this release:
For more information, see System Requirements and Technical Prerequisites.
Highlights of this release:
Learn with our latest video tutorials
The Digital Boardroom (Beta) that we introduced in Release 2017.13 is now also supported in the mobile app!
Need to quickly navigate to a specific page? You can now tap items in a presentation to jump to another page or topic within the presentation.
Save time by turning on the new Default Story/Presentation setting to automatically open a specific story or presentation when you launch the mobile app.
Creating a model and preparing your data is a critical step in ensuring that you are working with the right data for building stories and presentations. It takes careful planning. To help you in the process, we’ve made it possible for you to save preparatory drafts as you set up a model – so instead of having to create a model all in one go, you can now complete the model at your own convenience.
Another new feature is our new asynchronous publishing mode, which allows you to start the publishing process and immediately move on to other things while publishing takes place in the background. This is especially useful if you are working with large amounts of data.
You can now import master data into public dimensions. For an efficiency boost, you’ll get the same mapping suggestions that are available when you import data into models. In addition, importing into public dimensions can be scheduled.
You can now create charts from level-based hierarchies that are defined in HANA views.
Please note that level-based hierarchy dimensions can only be linked to other level-based hierarchy dimensions with the same number of levels. These links can only be used for filtering across models and not for blending.
Instead of having to refresh your browser window to retrieve the latest data for your stories, you can now manually refresh the data in your charts, tables, and geo maps. This capability is extended to any story widget that contains model-specific data, including input controls.
Sometimes when you’re building a chart or table, your data can seem to disappear if the number formatting isn’t set properly. Here’s a good example of this, where the numbers are displayed in the millions:
You can now choose to have your data and axis labels auto-formatted to display values in a different scale when filters make the values too small to be significant.
Here’s what happens when you go into the Styling Panel and select Auto-formatted in the Display As dropdown list – in this example, the application automatically scales them to the thousands:
You can now have numeric values AND embed bar charts within table cells for an account or cross calculation member.
You can now use separate measures in your tree maps for size and color, giving you an added layer of information within the same visualization.
When you hover over different areas of the tree map, the tooltip will show you the value corresponding to the measure that is associated with color. The legend title will also reflect the color measure.
In this release, we’ve made it easier for you to see your data on a geo map – you can now set your default map location to either the last saved view, or optimize the view automatically to fit all your data points.
We’ve also added two new buttons in the geo map toolbar that correspond to the same two settings, to replace the previous Default View button:
We’ve improved the Builder Panel for geo maps to allow you to filter on a single version (naturally, only for models that have a version to begin with) for each layer on a geo map. You can also hover over the geo map to see the version ID in the tooltip.
Want to add more polish and a personal touch to your responsive pages? You can now style each lane with different background colors, outlines, and text alignment. You can also dress up your lane titles by adding borders, shapes, and images.
A radar chart, one of our distribution chart types, can be used to view multiple variables in a two-dimensional way. For example, you could use it to look at the sales for each department throughout a calendar year.
In this release, you can now add thresholds to your radar charts to highlight information like low sales on a chart.
Threshold colors are visible on the data points, and you can also hover over to see details of the threshold.

You can now edit the fonts and colors inside RSS feeds, and select options for different parts including the RSS feed title, article title, and body. You can also choose between light and dark icon themes to suit the background.
For most model types, you can now restrict the number of measures and dimensions that are visible when users open stories or tables in the Explorer from the Digital Boardroom.
In this release, we’ve made a couple of enhancements to support your workflow with a better experience:
If you enjoy efficiency, you’ll love this new feature! You can now enter multiple values in a table grid without waiting for the system to update between entries.
Note: To prevent the possibility of conflicting data entries, each time you enter a cell value, the cells that aggregate up to it are locked until after you have left the editing session.
In a table based on a planning model, you can choose to copy a version without its values (i.e. empty private version). This feature allows you to add your own values to the dimensions, for example, by copying and pasting cells from another version.
Related links:
When you create a value driver tree, you can now create data source nodes based on accounts that use exception aggregation.
Are you an admin working in a large enterprise environment with a lot of users? We know how you feel. In this release, we’re introducing a new feature to help simplify and lighten your workload.
Now when you set up SAML SSO in SAP Analytics Cloud, you can enable dynamic user creation. When authenticated SAML users access your system for the first time, Analytics Cloud user accounts will be created automatically, and assigned whatever role(s) you have set as the default role(s) for your system.
Did you know you can use the Open Authorization (OAuth) protocol to allow third-party applications access to protected SAP Analytics Cloud resources? If you use the OAuth 2.0 SAML Bearer Assertion workflow, however, you will also need to configure a trusted identity provider.
Starting with this release, you can now add multiple trusted SAML identity providers to SAP Analytics Cloud, in the System > Administration > OAuth Clients area.
Related community blogs:
If you are an admin for your system, you can now navigate through all folders, subfolders, and content that is created or uploaded into your tenant. This includes any content residing within private folders.
An OAuth 2.0 SAML Bearer Assertion based workflow is now used for live data connections to S/4HANA. Any connections you previously created can still be edited.
You can now filter the files area to show only your favorites.
*SAP Analytics Cloud was previously known as SAP BusinessObjects Cloud
**Legal disclaimer
SAP has no obligation to pursue any course of business outlined in this blog or any related presentation, or to develop or release any functionality mentioned therein. This blog, or any related presentation and SAP’s possible future developments, products and or platforms directions and functionality are all subject to change and may be changed by SAP at any time for any reason without notice. The information in this blog is not a commitment, promise or legal obligation to deliver any material, code, or functionality. This blog is provided without a warranty of any kind, either express or implied, including but not limited to, the implied warranties of merchantability, fitness for a particular purpose, or non-infringement. This blog is for informational purposes and may not be incorporated into a contract. SAP assumes no responsibility for errors or omissions in this document, except if such damages were caused by SAP’s willful misconduct or gross negligence.
All forward-looking statements are subject to various risks and uncertainties that could cause actual results to differ materially from expectations. Readers are cautioned not to place undue reliance on these forward-looking statements, and should not be relied upon in making purchasing decisions.
SAP Analytics Cloud agent version required for data acquisition with this release:
- Version 1.0.63 for the “export models to a file-server location” feature
- Version 1.0.59 for SAP Business Warehouse (BW)
- Version 1.0.57 for SAP ERP / SQL databases
- Version 1.0.51 for all other data source types
- Note: Although it is not required, you can upgrade to the new agent version 1.0.67, no matter what data acquisition type you use. Do this to take advantage of updates made to SAP Analytics Cloud agent.
For more information, see System Requirements and Technical Prerequisites.
Highlights of this release:
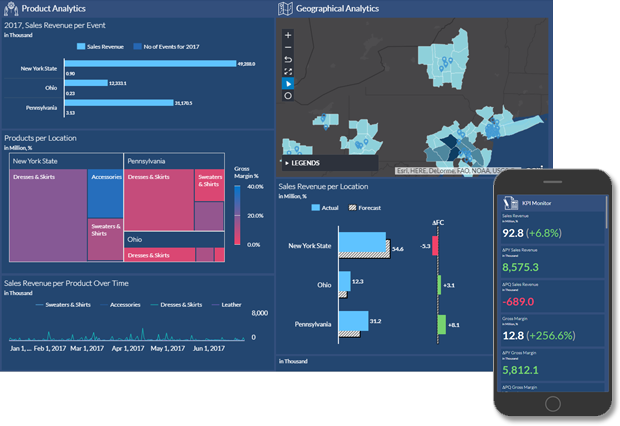
- Mobile support for the new Digital Boardroom (Beta)
- Mobile: Jump to navigation
- Mobile: Default story or presentation
- Enhanced data preparation: Drafts and background publishing
- Import master data from external sources into public dimension
- Consume level-based hierarchies modeled in HANA
- Manually refresh data for all visualizations
- Auto-scaled data labels for tables and charts
- In-cell charts
- Separate measures for size and color in tree maps
- Geo maps: Zoom to fit data
- Support for version filters in geo maps
- Format lanes on responsive pages
- Use thresholds in radar charts
- Improved styling for RSS tiles
- Configure the visibility of dimensions and measures in the Digital Boardroom Explorer
- Smart Discovery enhancements: Context sensitive help and simulation selection
- Planning: Mass data entry
- Planning: Start with an empty private version (version management)
- Value driver trees: Support for accounts with exception aggregations
- Automatic creation of authenticated SAML users
- Add multiple trusted SAML identity providers
- Admins can now navigate through all content
- S/4HANA live connections now use the OAuth 2.0 SAML Bearer Assertion based workflow
- Filter files to show only favorites
Learn with our latest video tutorials
- Create a connection and import a model and data from SAP BW
- Create a connection and import a model and data from SAP BPC
- Create a planning model starting with a blank model
- Full tutorial playlist >
Mobile
Mobile support for the new Digital Boardroom (Beta)
The Digital Boardroom (Beta) that we introduced in Release 2017.13 is now also supported in the mobile app!

Mobile: Jump to navigation
Need to quickly navigate to a specific page? You can now tap items in a presentation to jump to another page or topic within the presentation.

Mobile: Default story or presentation
Save time by turning on the new Default Story/Presentation setting to automatically open a specific story or presentation when you launch the mobile app.

Data Integration
Enhanced data preparation: Drafts and background publishing
Creating a model and preparing your data is a critical step in ensuring that you are working with the right data for building stories and presentations. It takes careful planning. To help you in the process, we’ve made it possible for you to save preparatory drafts as you set up a model – so instead of having to create a model all in one go, you can now complete the model at your own convenience.

Another new feature is our new asynchronous publishing mode, which allows you to start the publishing process and immediately move on to other things while publishing takes place in the background. This is especially useful if you are working with large amounts of data.

- Please note these improvements are currently only for tenants without Planning licenses only. We’re working to release these features for all tenants as soon as possible – stay tuned!
- Learn more about preparing data
- Visit our product tutorials page for videos on how to create models
Import master data from external sources into public dimensions
You can now import master data into public dimensions. For an efficiency boost, you’ll get the same mapping suggestions that are available when you import data into models. In addition, importing into public dimensions can be scheduled.

Data Analysis, Stories, and Tables
Consume level-based hierarchies modeled in HANA
You can now create charts from level-based hierarchies that are defined in HANA views.

Please note that level-based hierarchy dimensions can only be linked to other level-based hierarchy dimensions with the same number of levels. These links can only be used for filtering across models and not for blending.
Manually refresh data for all visualizations
Instead of having to refresh your browser window to retrieve the latest data for your stories, you can now manually refresh the data in your charts, tables, and geo maps. This capability is extended to any story widget that contains model-specific data, including input controls.

- Learn how to build a story automatically (video tutorial)
- Learn how to create a simple geo map in a story (video tutorial)
- Learn how to build charts in a story (video tutorial)
- Learn more about stories
Auto-scaled data labels for tables and charts
Sometimes when you’re building a chart or table, your data can seem to disappear if the number formatting isn’t set properly. Here’s a good example of this, where the numbers are displayed in the millions:

You can now choose to have your data and axis labels auto-formatted to display values in a different scale when filters make the values too small to be significant.
Here’s what happens when you go into the Styling Panel and select Auto-formatted in the Display As dropdown list – in this example, the application automatically scales them to the thousands:

In-cell charts
You can now have numeric values AND embed bar charts within table cells for an account or cross calculation member.

- You can configure in-cell charts by displaying or hiding data labels, and modifying the axis line color and/or the color palette.
- The first swatch in the color palette will be used to color the chart.
- Learn how to add in-cell charts to table columns
Separate measures for size and color in tree maps
You can now use separate measures in your tree maps for size and color, giving you an added layer of information within the same visualization.
When you hover over different areas of the tree map, the tooltip will show you the value corresponding to the measure that is associated with color. The legend title will also reflect the color measure.

- Learn how build to charts in a story (video tutorial)
- Learn more about creating charts
Geo maps: Zoom to fit data
In this release, we’ve made it easier for you to see your data on a geo map – you can now set your default map location to either the last saved view, or optimize the view automatically to fit all your data points.
We’ve also added two new buttons in the geo map toolbar that correspond to the same two settings, to replace the previous Default View button:
- Zoom to Data – zooms to an optimized level that shows all data points on the map (optimized to fit data points).
- Return to Last Saved – returns to the view the map was in when the story was last saved.

- Learn how to create a simple geo map in a story (video tutorial)
- Learn how to enrich data to support geo maps based on region (video tutorial)
- Learn more about analyzing geographical data and creating a geo map
Support for version filters in geo maps
We’ve improved the Builder Panel for geo maps to allow you to filter on a single version (naturally, only for models that have a version to begin with) for each layer on a geo map. You can also hover over the geo map to see the version ID in the tooltip.

- Learn how to create a simple geo map in a story (video tutorial)
- Learn how to enrich data to support geo maps based on region (video tutorial)
- Learn more about analyzing geographical data and creating a geo map
Format lanes on responsive pages
Want to add more polish and a personal touch to your responsive pages? You can now style each lane with different background colors, outlines, and text alignment. You can also dress up your lane titles by adding borders, shapes, and images.
- Learn how to create a responsive page (video tutorial)
- Learn more about responsive lanes
Use thresholds in radar charts
A radar chart, one of our distribution chart types, can be used to view multiple variables in a two-dimensional way. For example, you could use it to look at the sales for each department throughout a calendar year.
In this release, you can now add thresholds to your radar charts to highlight information like low sales on a chart.

Threshold colors are visible on the data points, and you can also hover over to see details of the threshold.
- Learn how to set thresholds in a story (video tutorial)
- Learn more about conditional formatting in stories
Improved styling for RSS tiles
You can now edit the fonts and colors inside RSS feeds, and select options for different parts including the RSS feed title, article title, and body. You can also choose between light and dark icon themes to suit the background.

Configure the visibility of dimensions and measures in the Digital Boardroom Explorer
For most model types, you can now restrict the number of measures and dimensions that are visible when users open stories or tables in the Explorer from the Digital Boardroom.

- By default, dimensions and measures used within a visualization are selected and cannot be removed.
- Likewise, if you have measures with required dimensions, those required dimensions will also be selected by default and cannot be removed.
- Learn how to access the Explorer
Predictive
Smart Discovery enhancements
In this release, we’ve made a couple of enhancements to support your workflow with a better experience:
- Context sensitive help is now available when running Smart Discoveries.
- After running a Smart Discovery, you can now see how any changes made under Simulation Selection will affect the currently displayed numeric targets.

- Learn more about Smart Discoveries
- Learn how to use Smart Discovery and Smart Insights in a story (video tutorial)
Planning
Mass data entry
If you enjoy efficiency, you’ll love this new feature! You can now enter multiple values in a table grid without waiting for the system to update between entries.

Note: To prevent the possibility of conflicting data entries, each time you enter a cell value, the cells that aggregate up to it are locked until after you have left the editing session.
Start with an empty private version (version management)
In a table based on a planning model, you can choose to copy a version without its values (i.e. empty private version). This feature allows you to add your own values to the dimensions, for example, by copying and pasting cells from another version.
![]()
Related links:
- Learn how to create a planning model starting with a blank model (video tutorial)
- Learn how to create a planning model using the Planning Wizard (video tutorial)
Value driver trees: Support for accounts with exception aggregations
When you create a value driver tree, you can now create data source nodes based on accounts that use exception aggregation.

- Learn more about value driver trees
- Learn more about the different exception aggregation types
- Learn more about applying aggregation and exception aggregation settings in models (video tutorial)
Infrastructure
Automatic creation of authenticated SAML users
Are you an admin working in a large enterprise environment with a lot of users? We know how you feel. In this release, we’re introducing a new feature to help simplify and lighten your workload.
Now when you set up SAML SSO in SAP Analytics Cloud, you can enable dynamic user creation. When authenticated SAML users access your system for the first time, Analytics Cloud user accounts will be created automatically, and assigned whatever role(s) you have set as the default role(s) for your system.
- Learn how to enable SAML Single Sign-On (SSO)
- Learn how to map roles using SAML attributes
- Learn how to map SAML attributes to users
Add multiple trusted SAML identity providers
Did you know you can use the Open Authorization (OAuth) protocol to allow third-party applications access to protected SAP Analytics Cloud resources? If you use the OAuth 2.0 SAML Bearer Assertion workflow, however, you will also need to configure a trusted identity provider.
Starting with this release, you can now add multiple trusted SAML identity providers to SAP Analytics Cloud, in the System > Administration > OAuth Clients area.
Related community blogs:
- SAML authentication in SAP Analytics Cloud
- SSO Setup for SAP Analytics Cloud using okta as an Identity Provider
Admins can now navigate through all content
If you are an admin for your system, you can now navigate through all folders, subfolders, and content that is created or uploaded into your tenant. This includes any content residing within private folders.
S/4HANA live connections now use the OAuth 2.0 SAML Bearer Assertion based workflow
An OAuth 2.0 SAML Bearer Assertion based workflow is now used for live data connections to S/4HANA. Any connections you previously created can still be edited.
Filter files to show only favorites
You can now filter the files area to show only your favorites.
Additional resources:
- Video tutorials
- Events and recordings
- SAP BusinessObjects help resources
- Official roadmap contains more info on future plans, subject to change.
Previous feature summary blogs:
- SAP BusinessObjects Cloud release 2017.13
- SAP BusinessObjects Cloud release 2017.12
- SAP BusinessObjects Cloud release 2017.11
- More >
*SAP Analytics Cloud was previously known as SAP BusinessObjects Cloud
**Legal disclaimer
SAP has no obligation to pursue any course of business outlined in this blog or any related presentation, or to develop or release any functionality mentioned therein. This blog, or any related presentation and SAP’s possible future developments, products and or platforms directions and functionality are all subject to change and may be changed by SAP at any time for any reason without notice. The information in this blog is not a commitment, promise or legal obligation to deliver any material, code, or functionality. This blog is provided without a warranty of any kind, either express or implied, including but not limited to, the implied warranties of merchantability, fitness for a particular purpose, or non-infringement. This blog is for informational purposes and may not be incorporated into a contract. SAP assumes no responsibility for errors or omissions in this document, except if such damages were caused by SAP’s willful misconduct or gross negligence.
All forward-looking statements are subject to various risks and uncertainties that could cause actual results to differ materially from expectations. Readers are cautioned not to place undue reliance on these forward-looking statements, and should not be relied upon in making purchasing decisions.
- SAP Managed Tags:
- SAP Analytics Cloud,
- SAP Analytics Cloud for planning
7 Comments
You must be a registered user to add a comment. If you've already registered, sign in. Otherwise, register and sign in.
Labels in this area
-
ABAP CDS Views - CDC (Change Data Capture)
2 -
AI
1 -
Analyze Workload Data
1 -
BTP
1 -
Business and IT Integration
2 -
Business application stu
1 -
Business Technology Platform
1 -
Business Trends
1,658 -
Business Trends
92 -
CAP
1 -
cf
1 -
Cloud Foundry
1 -
Confluent
1 -
Customer COE Basics and Fundamentals
1 -
Customer COE Latest and Greatest
3 -
Customer Data Browser app
1 -
Data Analysis Tool
1 -
data migration
1 -
data transfer
1 -
Datasphere
2 -
Event Information
1,400 -
Event Information
66 -
Expert
1 -
Expert Insights
177 -
Expert Insights
298 -
General
1 -
Google cloud
1 -
Google Next'24
1 -
Kafka
1 -
Life at SAP
780 -
Life at SAP
13 -
Migrate your Data App
1 -
MTA
1 -
Network Performance Analysis
1 -
NodeJS
1 -
PDF
1 -
POC
1 -
Product Updates
4,577 -
Product Updates
344 -
Replication Flow
1 -
RisewithSAP
1 -
SAP BTP
1 -
SAP BTP Cloud Foundry
1 -
SAP Cloud ALM
1 -
SAP Cloud Application Programming Model
1 -
SAP Datasphere
2 -
SAP S4HANA Cloud
1 -
SAP S4HANA Migration Cockpit
1 -
Technology Updates
6,873 -
Technology Updates
421 -
Workload Fluctuations
1
Related Content
- Composite Data Source Configuration in Optimized Story Experience in Technology Blogs by SAP
- 体验更丝滑!SAP 分析云 2024.07 版功能更新 in Technology Blogs by SAP
- Top Picks: Innovations Highlights from SAP Business Technology Platform (Q1/2024) in Technology Blogs by SAP
- What’s New in SAP Analytics Cloud Release 2024.08 in Technology Blogs by SAP
- Sneak Peek in to SAP Analytics Cloud release for Q2 2024 in Technology Blogs by SAP
Top kudoed authors
| User | Count |
|---|---|
| 38 | |
| 25 | |
| 17 | |
| 13 | |
| 7 | |
| 7 | |
| 7 | |
| 7 | |
| 6 | |
| 6 |