
- SAP Community
- Products and Technology
- Technology
- Technology Blogs by SAP
- Mobile Services Debugging and Root Cause Analysis ...
Technology Blogs by SAP
Learn how to extend and personalize SAP applications. Follow the SAP technology blog for insights into SAP BTP, ABAP, SAP Analytics Cloud, SAP HANA, and more.
Turn on suggestions
Auto-suggest helps you quickly narrow down your search results by suggesting possible matches as you type.
Showing results for
michael_jess
Participant
Options
- Subscribe to RSS Feed
- Mark as New
- Mark as Read
- Bookmark
- Subscribe
- Printer Friendly Page
- Report Inappropriate Content
07-20-2017
2:03 PM
Introduction
Let's be honest: If you go around asking people about what they think developers ("programmers") do all day, they would most likely come up with clichés such as "sitting in a basement, drinking coffee, hacking away." Quite frankly, this may be not too far from reality, but I think the following diagram draws a more accurate picture of a typical day in the life of a developer:

Fig. 1: Programming: Expectation vs. Reality
Admittedly, you should take that one with a grain of salt. However, what it really does capture is how much time typically goes into finding out why something stopped working. In some cases, it takes days of debugging, logging, analyzing and isolating components until the root cause of failure in a distributed system is identified – and that is assuming that it is reproducible at all. In my experience, tricky issues are rarely confined to the location where they become visible (e.g. a mobile app), but are rooted somewhere in a poorly tested backend or misconfigured middleware component. This is why it is invaluable to develop soft skills such as distinct analytical thinking, but also to know what tools are available in order to narrow down the scenario until it is possible to pinpoint the actual issue.
Today I would like to use a semi-constructed scenario in which the cause is not immediately apparent. We are going to investigate synchronization errors in an Offline app, which is just our Mobile Interactive Tutorials, tweaked to reliably fail under certain circumstances. Before we dig into this, please note that I am not going to show the shortest path to success, but take a detour here and there in order to cover some more debugging tools. Discovering shortcuts along the way requires both intuition and experience, and you certainly can't have both when you first start using a new platform. And if everything else fails, knowing the tools helps a lot in supplying our customer support with additional logs and traces that can greatly reduce ticket processing times.
With that out of the way, let's take a look at the scenario and the issues we are seeing!
Table of Contents
Introduction
The Scenario
Client-Side Tools
Server-Side Tools
Isolating the Problematic Request and Fixing the Error
Summary
The Scenario
First, we are going to take a look at the solution architecture. Figure 2 is a very high-level sketch of our system, but it is detailed enough to understand what we need for our investigation. We are providing an offline-enabled Cordova-based hybrid mobile application built with the SAP Mobile Platform 3.0 Kapsel SDK. The app is registering with SAP Cloud Platform Mobile Services, which keeps track of app installations and provides access to a back-end system via Cloud Connector.

Fig. 2: High-level architecture
For the sake of clarification, I have built this scenario on top of SAP Cloud Platform trial, and I am using the portable Cloud Connector from my local laptop to tunnel the Mobile Services example from my Trial account back to my Trial account. This is by no means the intended usage of the Cloud Connector, but it is a simple setup for this blog and you can easily replicate it for your own experiments.
Now, the whole setup appears to work when we run online queries, as shown in Figure 3. Reading sales orders works, and the data is correctly displayed. However, when we try to open the Offline Store, there is a big bad red error message displayed at the top of the screen, as can be seen in Figure 4.

Fig. 3: Running an online query

Fig. 4: Error when opening the Offline Store
Client-Side Tools
So far, we can only see the error message, but as developers we know that those are typically linked to additional information that is not visible to the end user. Now, the immediate next step depends on the actual app platform and implementation. For native apps, you would go ahead and use the debugging tools of the respective IDE, such as Android Studio DDMS. In addition, Cordova hybrid apps may also be debugged using the respective vendor browser: Internet Explorer for Windows, Chrome for Android, and Safari for iOS. Since we are dealing with an Android hybrid app, we are starting our investigations with Chrome.
Web Debugging
Once you made sure that your device is connected and in developer mode, open chrome and browse to chrome://inspect/#devices. This will open the Chrome DevTools page shown in Figure 5. Selecting the "inspect" option below index.html will bring up the Chrome debugger that you may know from web app development history. We can immediately see the console output (Figure 6), which provides some more details than the message in the UI. However, to the uninitiated, this still looks rather cryptic.
Since our error appears to be linked to some server request, let's see instead if there is anything interesting in the HTTP trace. Unfortunately, when we hit the "Open Offline Store" button, nothing pops up in the network panel. Figure 7 shows what happens when we hit the "Read" button instead: We can inspect the HTTP request and response status, timing, headers and payload. The immediate conclusion at this point is: We cannot tell what happened from the web-based debug tools and we need to go deeper. We know that this is a hybrid app and each such app consists of both native and web-based modules, so the next best assumption is that some native component is failing which is not visible from the web module.

Fig. 5: The Chrome DevTools

Fig. 6: The Chrome DevTools JavaScript console

Fig. 7: The Chrome DevTools JavaScript console
Native Debugging
Indeed it turns out that the Offline functionality is implemented natively, so we move on and run the app from Android Studio in order to leverage DDMS. In addition to the same old error message, we do at least see the full stack trace (Figure 8), but it turns out that this is referring to some SDK component. Once more we are at a dead end, and we need to see if we can view what happens from a different angle in order to determine if something went wrong along the way.
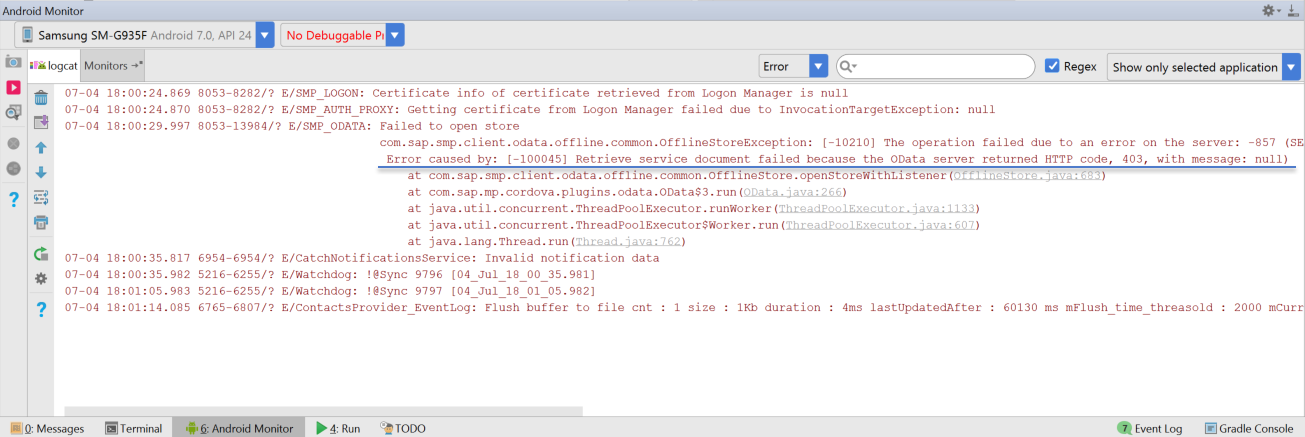
Fig. 8: Synchronization error as seen in the Android DDMS LogCat
Web Debugging Proxies
As a last resort, we are going to use a proxy as a man-in-the-middle in order to inspect the HTTP traffic that is flowing between the app and Mobile Services. Unfortunately, DDMS only provides low-level network traffic information, but nothing on the HTTP level. Therefore we are going to install Fiddler on our local development machine and reroute the traffic via our laptop. Make sure to have both your laptop and the device on the same network and that they are visible to each other. Then follow the Fiddler documentation on enabling HTTPS decryption and configuration for Android. Once this is done, we record the traffic and hit the "Open Offline Store" button again. A number of requests to Mobile Services pop up in the trace immediately, as shown in Figure 9. However, those are really confusing: They are all similarly pointing to some AsyncServlet on the remote server, and all of the requests return with status 200 OK. It appears that there is some HTTP-based offline sync protocol that is hiding the actual HTTP requests from us, and we can find out no more from the client side. At this point, we have run into a dead end and we need to move on in order to found out what's going on.

Fig. 9: Fiddler trace of the Offline synchronization
Server-Side Tools
Since we have learned everything we can from the client-side debugging tools, next we need to direct our attention further upstream. Indeed, the error message and status we received on the client indicate that there has been an authorization issue between Mobile Services and the backend system. It also indicates that the affected backend connection is "com.example.error", so let's first go and check if that one looks alright. Figure 10 is a screenshot of the configuration, and it does look fine.

Fig. 10: Mobile Services backend connection configuration
Isolating the Backend Service
Since we were able to receive data in the online case (cf. Figure 7), this is not very surprising. However, it may be worth a try to see if we can actually access the backend in isolation. The configuration confirms that we are in fact seeing a Cloud Connector connection, so we should go and see where the virtual host is pointing to. For that purpose, we need to open the Cloud Connector administration UI and check the host mapping. The screenshot in Figure 11 shows that the "internal host" is my Mobile Services trial runtime instance so we can reconstruct the request URL by exchanging the host in the backend connection definition (http://hcpms-dxxxxxxtrial.hanatrial.ondemand.com:80) with the internal host, resulting in the URL: https://hcpms-dxxxxxxtrial.hanatrial.ondemand.com:443/SampleServices/ESPM.svc. Calling that service URL in the browser results in an authentication challenge and properly returns the service root document, as shown in Figure 12. While we could not find any issue here, we could at least establish that this is, in fact, the service being called and that the service itself is working in isolation.

Fig. 11: Cloud Connector configuration

Fig. 12: Sample Service called directly from the browser
Mobile Services Event Log
At this point, we know that there has been a 403 between Mobile Services, but the backend works in isolation. In addition, the online scenario works, so it is unlikely that the 403 is actually related to user permissions on the service. So what was the actual request that Mobile Services sent to the backend? First, we should take a look at the server logs. Figure 13 is a screenshot of my server Event Log around the time of failure. Here we learn two things: Number one is that the failure occurred when the Offline component attempted to read the service document, which we found to be working in the previous step. Secondly, we see the request URL from the Proxy component log, and it is, in fact, pointing to the service document as it is tunneled via Cloud Connector. Unfortunately, we cannot replay this request from our local machine because the virtual Cloud Connector host is only visible from within our cloud account. But we should still see if we can isolate the action leading to this error so as to make it reproducible, which enables us to easily check if any potential fix addresses the issue. Secondly, we still did not see any evidence why the 403 is actually happening. Enter Network Traces.
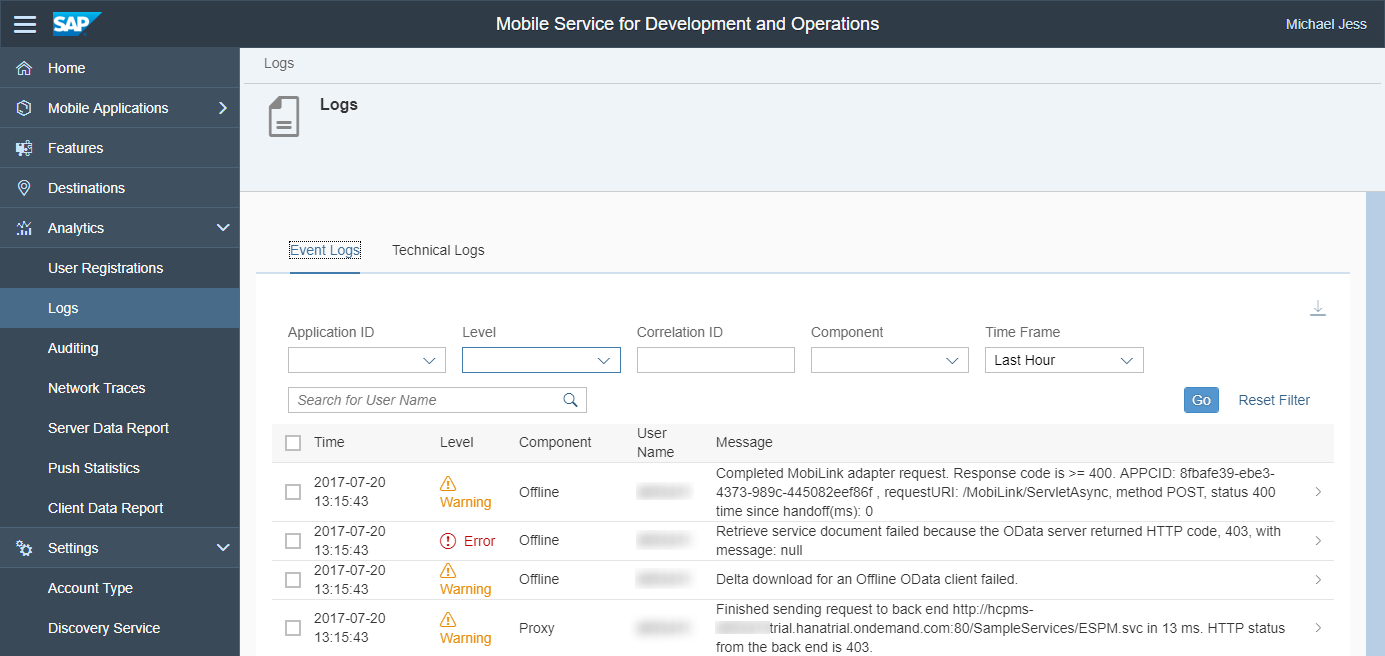
Fig. 13: Mobile Services Event Log
Mobile Services Network Traces
Whenever we find that the server logs just do not provide the right level of detail, we can just ask Mobile Services to trace incoming and outgoing requests and download them as archived HTTP requests in the HAR format. For this to happen, all we need to do is open the Network Traces page as shown in Figure 14. We limit the trace duration to one hour (in fact, we need way shorter than that), start the recording, trigger the error once more from the client device, stop recording, and download the resulting HAR file. In essence, this file contains a list of JSON representations of incoming and outgoing requests passing through Mobile Services. In order to see the exact request sent by Mobile Services, we search for 403 status codes and the first thing we find is, once more, the call we saw in the event log. Listing 1 below shows the crucial bits.

Fig. 14: Mobile Services Network Traces
{

	"startedDateTime": "2017-07-04T08:51:57.125+0000",

	"time": 64,

	"request": {

		"method": "GET",

		"url": "http://hcpms-dxxxxxxtrial.hanatrial.ondemand.com:80/SampleServices/ESPM.svc",

		[...]

	},

	"response": {

		"status": 403,

		"statusText": "FORBIDDEN",

		[...]

		"content": {

			"size": 183,

			"mimeType": "text/plain; charset\u003dutf-8",

			"text": "Access denied to resource / on system mybackend.svc. In case this was a valid request, ensure to expose the resource correctly in your SAP HANA Cloud connector."

		},

		[...]

	},

	[...]

}
Listing 1: Problematic request sent by Mobile Services
Here, we learn that there was an error message associated with the failure: "Access denied to resource /SampleServices/ESPM.svc on system hcpms-dxxxxxxtrial.hanatrial.ondemand.com. In case this was a valid request, ensure to expose the resource correctly in your SAP HANA Cloud connector." Since we already established that nothing is wrong with the backend service itself, this indicates we somehow misconfigured the Cloud Connector. However, before we jump to conclusions, let's hold on for a second and see if we can achieve our original goal of isolating the external HTTP request to Mobile Services that caused this internal request. It is useful to know that the HAR file is sorted in descending order by request timestamp, so if this request has been triggered by Mobile Services, the request that triggered this one, in turn, should just be the next one in the JSON array. The listing below shows this external request:
{

	"startedDateTime": "2017-07-04T08:51:57.120+0000",

	"time": 75,

	"request": {

		"method": "GET",

		"url": https: //hcpms-dxxxxxxtrial.hanatrial.ondemand.com:443/com.example.error,

		"cookies": [{

				"name": "X-SMP-APPCID",

				"value": "69953c0e-5b82-4210-8810-b010e0776815",

				"httpOnly": false,

				"secure": false

			}, {

				"name": "X-SUP-APPCID",

				"value": "69953c0e-5b82-4210-8810-b010e0776815",

				"httpOnly": false,

				"secure": false

			}

		],

		[...]

	},

	[...]

}
Listing 2: External request triggering the failing request in Listing 1
So apparently it is this GET request, sent from the client via the Offline sync protocol, that eventually leads to the error. We can clearly see that this is an external request, as opposed to the previous one since it targets the publicly visible Mobile Services host. Let's see if we can send this request on our own in order to test potential configuration changes in Cloud Connector.
Isolating the Problematic Request and Fixing the Error
For the next step, I recommend using cURL, or any other standalone tool that lets you fire requests, and strongly advise against the use of any tool integrated into browsers, such as Postman. The reason is that those integrated tools are subject to the browser cookie handling, and this may lead to unexpected results in conjunction with values stored in your browser session. In essence, those tools send more data than you actually see in their input forms. While those tools are great for demos, you should really only use them when you are 100% sure what you are doing.
For the request above, the cURL command looks as follows:
curl -I -X GET -H "X-SMP-APPCID: 69953c0e-5b82-4210-8810-b010e0776815" -u user:password https://hcpms-dxxxxxxtrial.hanatrial.ondemand.com:443/com.example.errorListing 3: cURL command to trigger the failing Mobile Services request
The -I switch has cURL print out headers and the status code. The -H switch lets you specify the essential X-SMP-APPCID header, which is the registration ID of your mobile app installation. The remaining pieces of information are your credentials for this app and the URL we identified as problematic in the previous step. When we run this query, we can indeed reproduce the error from the network trace:
HTTP/1.1 403 Forbidden

[…]


Access denied to resource /SampleServices/ESPM.svc on system hcpms-dxxxxxxtrial.hanatrial.ondemand.com:80. In case this was a valid request, ensure to expose the resource correctly in your cloud connector.
Now that we successfully isolated a single problematic request: What is actually going wrong? Now, it is time to pay close attention to the actual error message. According to the response, Mobile Services attempted to query /SampleServices/ESPM.svc via Cloud Connector. However, Figure 11 shows that we actually whitelisted /SampleServices/ESPM.svc/, with a trailing slash. And indeed, when we remove the trailing slash from the Cloud Connector resource whitelist, we can rerun the above cURL command and finally see a:
HTTP/1.1 200 OK

[…]
So it turns out that Cloud Connector is very strict when it does URL matching, and does not consider the same URL with and without a trailing slash equivalent. Let's go back to the Tutorial app and see if this actually fixed our issue:

Fig. 15: Working Offline synchronization after the configuration issue has been resolved
At long last, it is working!
Summary
In this rather lengthy blog, we took a tour through the various debugging and analysis tools at your disposal in our everyday struggle of integrating systems. We took some detours left and right in order to learn about as many tools as possible, and established a vast amount of evidence along the way that helped us exclude many failure scenarios and identify a service request that reliably reproduces the issue. In the very end, the root cause was a misconfigured Cloud Connector, which would only become noticeable in some corner cases. Now before I let you go with your heads spinning in the face of a dozen tools used to diagnose this rather simple issue, I would like to give you a more concise route to the very same goal, based on the minimum amount of information required:
- The client-side message indicates authorization issues between Mobile Services and the backend (Figure 4). Therefore we could probably skip any further client-side investigation, and save it for later, if need be. We also set user authorization/authentication issues aside for a moment, since Online works fine.
- We take a look at the server event log instead and see that there is an associated error (Figure 13). We take notice of the exact request URL and backend connection ID.
- When we check the backend connection, we see that this is a Cloud Connector connection (Figure 10)
- We move on to the Cloud Connector and see that the resource whitelist does not match the request (Figure 11).
- We fix the Cloud Connector resource whitelist and verify that the app is now working (Figure 15).
And if you would have required additional intermediate steps, don't worry: Practice makes perfect, and it never hurts to gather supporting facts along the way.
- SAP Managed Tags:
- SAP Mobile Services,
- SAP Mobile Platform,
- SAP Mobile Platform SDK,
- SAP Business Technology Platform
3 Comments
You must be a registered user to add a comment. If you've already registered, sign in. Otherwise, register and sign in.
Labels in this area
-
ABAP CDS Views - CDC (Change Data Capture)
2 -
AI
1 -
Analyze Workload Data
1 -
BTP
1 -
Business and IT Integration
2 -
Business application stu
1 -
Business Technology Platform
1 -
Business Trends
1,661 -
Business Trends
88 -
CAP
1 -
cf
1 -
Cloud Foundry
1 -
Confluent
1 -
Customer COE Basics and Fundamentals
1 -
Customer COE Latest and Greatest
3 -
Customer Data Browser app
1 -
Data Analysis Tool
1 -
data migration
1 -
data transfer
1 -
Datasphere
2 -
Event Information
1,400 -
Event Information
65 -
Expert
1 -
Expert Insights
178 -
Expert Insights
280 -
General
1 -
Google cloud
1 -
Google Next'24
1 -
Kafka
1 -
Life at SAP
784 -
Life at SAP
11 -
Migrate your Data App
1 -
MTA
1 -
Network Performance Analysis
1 -
NodeJS
1 -
PDF
1 -
POC
1 -
Product Updates
4,577 -
Product Updates
330 -
Replication Flow
1 -
RisewithSAP
1 -
SAP BTP
1 -
SAP BTP Cloud Foundry
1 -
SAP Cloud ALM
1 -
SAP Cloud Application Programming Model
1 -
SAP Datasphere
2 -
SAP S4HANA Cloud
1 -
SAP S4HANA Migration Cockpit
1 -
Technology Updates
6,886 -
Technology Updates
408 -
Workload Fluctuations
1
Related Content
- First hand experience at SAP Build Code - Learn, Try it out, Get a badge, SAP Discovery Centre in Technology Blogs by SAP
- Boosting Benchmarking for Reliable Business AI in Technology Blogs by SAP
- Product Updates for SAP Business Application Studio - March 2024 Edition in Technology Blogs by SAP
- Consume Machine Learning API in SAPUI5, SAP Build, SAP ABAP Cloud and SAP Fiori IOS SDK in Technology Blogs by Members
- Global Explanation Capabilities in SAP HANA Machine Learning in Technology Blogs by SAP
Top kudoed authors
| User | Count |
|---|---|
| 13 | |
| 10 | |
| 10 | |
| 9 | |
| 8 | |
| 7 | |
| 6 | |
| 5 | |
| 5 | |
| 5 |