
- SAP Community
- Products and Technology
- Technology
- Technology Blogs by SAP
- Cloud Integration – Configure Dead Letter Handling...
Technology Blogs by SAP
Learn how to extend and personalize SAP applications. Follow the SAP technology blog for insights into SAP BTP, ABAP, SAP Analytics Cloud, SAP HANA, and more.
Turn on suggestions
Auto-suggest helps you quickly narrow down your search results by suggesting possible matches as you type.
Showing results for
Advisor
Options
- Subscribe to RSS Feed
- Mark as New
- Mark as Read
- Bookmark
- Subscribe
- Printer Friendly Page
- Report Inappropriate Content
07-17-2017
8:11 AM
This blog describes the Dead Letter Queue option in the JMS sender adapter. It describes the feature, when to use it, and how to monitor it. Dead letter handling in the JMS sender adapter is available for SAP Cloud Integration customers with an Enterprise Edition license.
Some messages, (usually large messages), received in the cloud integration system have the potential to lead to an out-of-memory error in the worker node, because processing the message requires too much memory.
If such messages are processed in an asynchronously decoupled scenario using JMS, the message is stored in the JMS queue via the inbound flow, where there are normally no memory consuming conversions. But in the outbound flow, the message may cause the problem described above: The node fails due to lack of memory, Cloud Platform restarts the node, the message is polled again from the queue and therefore causing another out-of-memory error. The node restart would try to process the message again and again, leading to complete node unavailability.
To avoid this situation, messages where processing stopped unexpectedly, are retried only twice. After that the message is taken out of processing and stored in a dead letter queue. Manual action is necessary to restart or delete such messages.
The blog Configure Asynchronous Messaging with Retry using JMS Adapter describes in detail how to setup asynchronous scenarios using the JMS adapter.
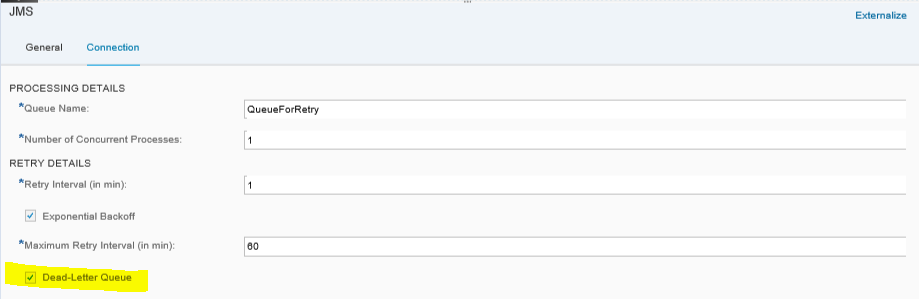
In the JMS sender adapter, the dead letter queue can be configured as of JMS adapter version 1.1. The checkbox, Dead-Letter Queue, for activating the dead letter queue is available on the Connection tab. The checkbox is selected by default, meaning that dead letter handling is active. After the second retry of a message that could not be completed because of a node crash, this message is moved to a dead letter queue and not processed any further. The number of retries is not configurable.
The Dead-Letter Queue handling is a performance intensive operation, so you should expect a significant impact on the performance. This impact is even higher if you run high-load scenarios. This is because the Dead-Letter Queue handling is based on the database and the database does not scale as good as JMS.
For high-load scenarios or if you are sure that only small messages will be processed in your scenario, you should deselect the checkbox to improve the performance, but do keep the risk of an outage in mind. The recommended configuration would be to configure the size check in the used sender adapter and with this configuration reject large messages to avoid that a large message can cause an out-of-memory. Unfortunately not all sender adapters support the size check yet.
If you open an old integration flow, the Dead-Letter Queue setting might not be available because the version of the JMS adapter is too old. To find out the version choose the Technical Information icon in the channel. If you want to use the dead letter handling option, delete the sender channel and add it new from the palette. You will then get the latest version.

The dead letter queue configuration is not connected to the configuration of explicit retry handling described in the blog Configure Asynchronous Messaging with Retry Using JMS Adapter. The dead letter queue is only used for messages that could no longer be processed anymore because of a node crash.
Messages that fail because of an error during processing, do not go to the dead letter queue, but either stay in the normal processing (with a defined retry interval) or are removed from JMS (if configured in explicit retry modeling).
To check whether messages have been removed from processing and moved to the dead letter queue, you can use the monitoring tools provided by Cloud Integration.
As soon as a message is processed by the JMS sender adapter, a processing lock for this particular message is shown in the Message Locks monitor. The monitor is in the operations view, in the section Manage Locks. The messages belonging to the JMS sender adapter can be identified by the component JMS. The Source column tells you which JMS queue the message is processed in, in the format JMS:<queue name>.

Normally, this entry is removed as soon as processing of the message is completed. In the case of a node outage, processing cannot be completed and when the node is started, the message is marked as erroneous and the entry will disappear from the lock monitor. After approximately 20 minutes a retry is executed. If processing cannot be completed because of another node outage, a second retry is triggered.
After the second retry, the message is moved to a dead letter queue and can be found in the Queue Monitor (described in the next chapter).
You can check the message that was taken out of processing in the Message Queue monitor, which is in the operations view, in the section Manage Stores.
If messages have the processing status Blocked, this indicates that these messages have been removed from processing and moved to the dead letter queue. You also see that no time is defined for the next retry for these messages:

The easiest way to find these messages is to use the filter option or sort based on Status.

You can use the direct link for the message ID to jump directly to the message processing log for the message sent to the queue. There, you can find the integration flow name, the time the message was sent, and details of processing.

To find out, whether the message was causing the outages, you can download the message and check its size. On the basis of this analysis you can decide, whether to completely remove the message from processing, change your integration flow, and/or try to send the message again:

Dead Letter Handling in JMS Sender Adapter
Some messages, (usually large messages), received in the cloud integration system have the potential to lead to an out-of-memory error in the worker node, because processing the message requires too much memory.
If such messages are processed in an asynchronously decoupled scenario using JMS, the message is stored in the JMS queue via the inbound flow, where there are normally no memory consuming conversions. But in the outbound flow, the message may cause the problem described above: The node fails due to lack of memory, Cloud Platform restarts the node, the message is polled again from the queue and therefore causing another out-of-memory error. The node restart would try to process the message again and again, leading to complete node unavailability.
To avoid this situation, messages where processing stopped unexpectedly, are retried only twice. After that the message is taken out of processing and stored in a dead letter queue. Manual action is necessary to restart or delete such messages.
Prerequisite: Broker Provisioning and Setup of JMS Scenario
The blog Configure Asynchronous Messaging with Retry using JMS Adapter describes in detail how to setup asynchronous scenarios using the JMS adapter.
Configure Dead Letter Handling in JMS Sender Channel
In the JMS sender adapter, the dead letter queue can be configured as of JMS adapter version 1.1. The checkbox, Dead-Letter Queue, for activating the dead letter queue is available on the Connection tab. The checkbox is selected by default, meaning that dead letter handling is active. After the second retry of a message that could not be completed because of a node crash, this message is moved to a dead letter queue and not processed any further. The number of retries is not configurable.
Performance Impact of the Configuration
The Dead-Letter Queue handling is a performance intensive operation, so you should expect a significant impact on the performance. This impact is even higher if you run high-load scenarios. This is because the Dead-Letter Queue handling is based on the database and the database does not scale as good as JMS.
For high-load scenarios or if you are sure that only small messages will be processed in your scenario, you should deselect the checkbox to improve the performance, but do keep the risk of an outage in mind. The recommended configuration would be to configure the size check in the used sender adapter and with this configuration reject large messages to avoid that a large message can cause an out-of-memory. Unfortunately not all sender adapters support the size check yet.
Checkbox Not Available - JMS Adapter Version Too Old
If you open an old integration flow, the Dead-Letter Queue setting might not be available because the version of the JMS adapter is too old. To find out the version choose the Technical Information icon in the channel. If you want to use the dead letter handling option, delete the sender channel and add it new from the palette. You will then get the latest version.
Dead Letter Queue Versus Explicit Retry Configuration
The dead letter queue configuration is not connected to the configuration of explicit retry handling described in the blog Configure Asynchronous Messaging with Retry Using JMS Adapter. The dead letter queue is only used for messages that could no longer be processed anymore because of a node crash.
Messages that fail because of an error during processing, do not go to the dead letter queue, but either stay in the normal processing (with a defined retry interval) or are removed from JMS (if configured in explicit retry modeling).
Monitoring
To check whether messages have been removed from processing and moved to the dead letter queue, you can use the monitoring tools provided by Cloud Integration.
Monitor Message Locks in Manage Lock Monitor
As soon as a message is processed by the JMS sender adapter, a processing lock for this particular message is shown in the Message Locks monitor. The monitor is in the operations view, in the section Manage Locks. The messages belonging to the JMS sender adapter can be identified by the component JMS. The Source column tells you which JMS queue the message is processed in, in the format JMS:<queue name>.
Normally, this entry is removed as soon as processing of the message is completed. In the case of a node outage, processing cannot be completed and when the node is started, the message is marked as erroneous and the entry will disappear from the lock monitor. After approximately 20 minutes a retry is executed. If processing cannot be completed because of another node outage, a second retry is triggered.
After the second retry, the message is moved to a dead letter queue and can be found in the Queue Monitor (described in the next chapter).
Monitor Corresponding Message in Message Queue Monitor
You can check the message that was taken out of processing in the Message Queue monitor, which is in the operations view, in the section Manage Stores.
If messages have the processing status Blocked, this indicates that these messages have been removed from processing and moved to the dead letter queue. You also see that no time is defined for the next retry for these messages:
The easiest way to find these messages is to use the filter option or sort based on Status.
You can use the direct link for the message ID to jump directly to the message processing log for the message sent to the queue. There, you can find the integration flow name, the time the message was sent, and details of processing.
Analyze and Solve the Root Cause
To find out, whether the message was causing the outages, you can download the message and check its size. On the basis of this analysis you can decide, whether to completely remove the message from processing, change your integration flow, and/or try to send the message again:
- If you decide to remove the message completely from processing, delete the message in the Message Queue monitor. Ask the sender of the message to send it in smaller chunks, if possible.
- If you decide to retry the message, choose Retry for this message in the Queue Monitor. The JMS sender adapter will trigger one more retry. Carefully monitor the node to see if it crashes again. If it does, you can be quite sure that it is the message that is causing the outage.
- SAP Managed Tags:
- SAP Integration Suite,
- Cloud Integration
Labels:
17 Comments
You must be a registered user to add a comment. If you've already registered, sign in. Otherwise, register and sign in.
Labels in this area
-
ABAP CDS Views - CDC (Change Data Capture)
2 -
AI
1 -
Analyze Workload Data
1 -
BTP
1 -
Business and IT Integration
2 -
Business application stu
1 -
Business Technology Platform
1 -
Business Trends
1,661 -
Business Trends
87 -
CAP
1 -
cf
1 -
Cloud Foundry
1 -
Confluent
1 -
Customer COE Basics and Fundamentals
1 -
Customer COE Latest and Greatest
3 -
Customer Data Browser app
1 -
Data Analysis Tool
1 -
data migration
1 -
data transfer
1 -
Datasphere
2 -
Event Information
1,400 -
Event Information
64 -
Expert
1 -
Expert Insights
178 -
Expert Insights
273 -
General
1 -
Google cloud
1 -
Google Next'24
1 -
Kafka
1 -
Life at SAP
784 -
Life at SAP
11 -
Migrate your Data App
1 -
MTA
1 -
Network Performance Analysis
1 -
NodeJS
1 -
PDF
1 -
POC
1 -
Product Updates
4,577 -
Product Updates
327 -
Replication Flow
1 -
RisewithSAP
1 -
SAP BTP
1 -
SAP BTP Cloud Foundry
1 -
SAP Cloud ALM
1 -
SAP Cloud Application Programming Model
1 -
SAP Datasphere
2 -
SAP S4HANA Cloud
1 -
SAP S4HANA Migration Cockpit
1 -
Technology Updates
6,886 -
Technology Updates
404 -
Workload Fluctuations
1
Related Content
- 10+ ways to reshape your SAP landscape with SAP BTP - Blog 4 Interview in Technology Blogs by SAP
- 10+ ways to reshape your SAP landscape with SAP Business Technology Platform – Blog 4 in Technology Blogs by SAP
- SAP GUI for Java 8.10 on the Horizon in Technology Blogs by SAP
- SAP Enable Now setup in Technology Blogs by Members
- How can we do error handling in an interface on public cloud where integration is done on APIgee? in Technology Q&A
Top kudoed authors
| User | Count |
|---|---|
| 13 | |
| 10 | |
| 10 | |
| 7 | |
| 7 | |
| 6 | |
| 6 | |
| 5 | |
| 5 | |
| 4 |