
- SAP Community
- Products and Technology
- Technology
- Technology Blogs by SAP
- Consume on premise predictive models in SAP Analyt...
Technology Blogs by SAP
Learn how to extend and personalize SAP applications. Follow the SAP technology blog for insights into SAP BTP, ABAP, SAP Analytics Cloud, SAP HANA, and more.
Turn on suggestions
Auto-suggest helps you quickly narrow down your search results by suggesting possible matches as you type.
Showing results for
former_member19
Active Participant
Options
- Subscribe to RSS Feed
- Mark as New
- Mark as Read
- Bookmark
- Subscribe
- Printer Friendly Page
- Report Inappropriate Content
07-02-2017
4:19 PM
Often, I encounter questions from customers on how they can leverage their on premise predictive models in SAP Analytics Cloud environment and visualize and benefit from the results. In this blog, I described the steps required to create a predictive model on SAP HANA using SAP Predictive Analytics then consume the results in SAP Analytics Cloud.
Let’s consider a use case where CRM (Customer Relation Management) data in SAP HANA on premise system is required to predict the organizations revenue for next quarter. There after a nice visualization can be built in SAP Analytics Cloud for the business users. There is huge amount of value in this use case when you add in SAP Predictive Analytics data manager to do data preparation and automate the creation of the scores using Automated Analytics, as in this process the reports and stories in SAP Analytics Cloud are kept up to date.
SAP Predictive Analytics – Automated Analytics mode or Expert mode can be exploited to create predictive models on the data stored in SAP HANA. Then the SQL from Automated Analytics code generator or Stored Procedure exported from Expert Analytics can be embedded in a calculation view. An Apache HTTP server or SAP Web Dispatcher must be configured as a reverse proxy. Finally SAP Analytics Cloud can connect to calculation view using a live data connection.

Log on to SAP Analytics Cloud and create a new connection to the on-premise HANA system.

Provide the path of the HANA connection , UID and PW.

Hit the ok button to save the connection.
Using the Automated Analytics mode
Open the Predictive Analytics Desktop tool.

Next, I will specify the location of my training dataset from the SAP HANA system.

The dataset looks like below. In the table, You have all the historical claim information and TARGET field IS_FRAUD which marks the fraudulent claims from the past.

Now click on “Analyze” button to extract the metadata definition.

Select the independent and target variable, exclude any variable which can be highly co related with the target. For example, “Claim_ID”.

Finally generate the model.


Click on the next button and go to the SAVE section of the modeler and choose “Generate Source Code” option.


*******CODE FOR SCORING********************
SELECT claim_id,
(
( CAST( (CASE
WHEN ( "DAYS_TO_REPORT" IS NULL ) THEN 4.227952152315e-2
WHEN "DAYS_TO_REPORT" <= 0.0e0 THEN -1.046395403425e-1
WHEN "DAYS_TO_REPORT" <= 3.0e1 THEN ( -3.88853263231e-4*"DAYS_TO_REPORT"+4.733461394449e-2 )
ELSE 3.566901604756e-2
END) AS DOUBLE)+
CAST( (CASE
WHEN ( "BODILY_INJURY_AMOUNT" IS NULL ) THEN 2.791690244322e-1
WHEN "BODILY_INJURY_AMOUNT" <= 0.0e0 THEN -7.531522221077e-2
WHEN "BODILY_INJURY_AMOUNT" <= 3.5e1 THEN ( 9.137299945372e-6*"BODILY_INJURY_AMOUNT"-7.531522221074e-2 )
WHEN "BODILY_INJURY_AMOUNT" <= 3.6e1 THEN 9.187587116978e-2
WHEN "BODILY_INJURY_AMOUNT" <= 6.5e1 THEN ( 5.635347517772e-3*"BODILY_INJURY_AMOUNT"-1.109966394533e-1 )
WHEN "BODILY_INJURY_AMOUNT" <= 2.9694e4 THEN ( 9.137299945373e-6*"BODILY_INJURY_AMOUNT"+2.584090789814e-1 )
ELSE 5.297320635593e-1
END) AS DOUBLE)+
CAST( (CASE
WHEN ( "PROPERTY_DAMAGE" IS NULL ) THEN 3.102307096193e-2
WHEN "PROPERTY_DAMAGE" <= 2.8e1 THEN 1.938519862852e-2
WHEN "PROPERTY_DAMAGE" <= 1.057e3 THEN ( -9.797125087338e-7*"PROPERTY_DAMAGE"+1.941263057866e-2 )
WHEN "PROPERTY_DAMAGE" <= 1.059e3 THEN ( 8.09669314255e-3*"PROPERTY_DAMAGE"-8.5476743297e0 )
WHEN "PROPERTY_DAMAGE" <= 1.066e3 THEN ( 1.131025375949e-3*"PROPERTY_DAMAGE"-1.171032164869e0 )
WHEN "PROPERTY_DAMAGE" <= 2.117e3 THEN ( -9.239319573994e-7*"PROPERTY_DAMAGE"+3.605033404677e-2 )
WHEN "PROPERTY_DAMAGE" <= 3.995e3 THEN ( -9.173027585123e-7*"PROPERTY_DAMAGE"+3.603630003264e-2 )
WHEN "PROPERTY_DAMAGE" <= 6.546e3 THEN ( -1.0026833878e-6*"PROPERTY_DAMAGE"+3.637740025266e-2 )
WHEN "PROPERTY_DAMAGE" <= 6.61e3 THEN ( -3.783067033567e-5*"PROPERTY_DAMAGE"+2.774645706781e-1 )
WHEN "PROPERTY_DAMAGE" <= 6.648e3 THEN ( -6.202429689291e-5*"PROPERTY_DAMAGE"+4.373844422212e-1 )
WHEN "PROPERTY_DAMAGE" <= 4.5062e4 THEN ( -9.797125087338e-7*"PROPERTY_DAMAGE"+3.153245296781e-2 )
ELSE -1.261535210075e-2
END) AS DOUBLE)+
CAST( (CASE
WHEN ( "PAYMENT_METHOD" IS NULL OR "PAYMENT_METHOD" = '' ) THEN 3.680824732156e-2
WHEN "PAYMENT_METHOD" IN('CC') THEN 1.92163467088e-2
ELSE 3.680824732156e-2
END) AS DOUBLE)+
CAST( (CASE
WHEN ( "PREM_AMOUNT" IS NULL OR "PREM_AMOUNT" = '' ) THEN 3.746951801366e-2
WHEN "PREM_AMOUNT" IN('Safedriving_discount') THEN -1.634747595275e-3
ELSE 3.746951801366e-2
END) AS DOUBLE)+
CAST( (CASE
WHEN ( "AGE" IS NULL ) THEN 3.500244704649e-3
WHEN "AGE" <= 1.8e1 THEN 7.838834046102e-2
WHEN "AGE" <= 3.9e1 THEN ( -6.313441003348e-4*"AGE"+8.975253426565e-2 )
WHEN "AGE" <= 4.0e1 THEN 6.721540071162e-2
WHEN "AGE" <= 4.7e1 THEN ( -2.886755258385e-4*"AGE"+7.876242174494e-2 )
WHEN "AGE" <= 4.9e1 THEN ( 1.810515826793e-2*"AGE"-8.028147751493e-1 )
WHEN "AGE" <= 5.0e1 THEN ( 1.39968738011e-2*"AGE"-6.015088362726e-1 )
WHEN "AGE" <= 5.1e1 THEN 1.123317275852e-1
WHEN "AGE" <= 5.2e1 THEN 1.167689138613e-1
WHEN "AGE" <= 5.3e1 THEN 5.626550532057e-2
WHEN "AGE" <= 5.9e1 THEN ( -1.530054659884e-3*"AGE"+9.224341497777e-2 )
WHEN "AGE" <= 9.7e1 THEN ( -6.313441003348e-4*"AGE"+3.434738525709e-2 )
ELSE -2.689299247539e-2
END) AS DOUBLE)+
CAST( (CASE
WHEN ( "GENDER" IS NULL OR "GENDER" = '' ) THEN 2.595670445824e-2
WHEN "GENDER" IN('Female') THEN 2.746981982479e-2
ELSE 2.595670445824e-2
END) AS DOUBLE)+
CAST( (CASE
WHEN ( "INCOME_ESTIMATE" IS NULL ) THEN -1.100620855926e-2
WHEN "INCOME_ESTIMATE" <= 1.10284e2 THEN 2.466483632029e-2
WHEN "INCOME_ESTIMATE" <= 2.013945104213e4 THEN ( 1.765169506452e-6*"INCOME_ESTIMATE"+2.447016636997e-2 )
WHEN "INCOME_ESTIMATE" <= 2.01595e4 THEN ( 1.790305369523e-3*"INCOME_ESTIMATE"-3.599574762874e1 )
WHEN "INCOME_ESTIMATE" <= 2.239818046358e4 THEN ( 1.778280476528e-5*"INCOME_ESTIMATE"-2.625789844961e-1 )
WHEN "INCOME_ESTIMATE" <= 2.463686092715e4 THEN ( 1.778280476528e-5*"INCOME_ESTIMATE"-2.625789844921e-1 )
WHEN "INCOME_ESTIMATE" <= 2.786778612847e4 THEN ( -9.333313092882e-6*"INCOME_ESTIMATE"+4.054770400606e-1 )
WHEN "INCOME_ESTIMATE" <= 2.93686e4 THEN ( -4.96704225229e-5*"INCOME_ESTIMATE"+1.52958297869e0 )
WHEN "INCOME_ESTIMATE" <= 3.596061268238e4 THEN ( -9.945252443153e-6*"INCOME_ESTIMATE"+3.629103486791e-1 )
WHEN "INCOME_ESTIMATE" <= 4.88414e4 THEN ( -1.301901238443e-6*"INCOME_ESTIMATE"+5.209014372709e-2 )
WHEN "INCOME_ESTIMATE" <= 4.889217850241e4 THEN ( -7.762468646546e-4*"INCOME_ESTIMATE"+3.790148707992e1 )
WHEN "INCOME_ESTIMATE" <= 9.96199e4 THEN ( 1.765169506452e-6*"INCOME_ESTIMATE"-1.372161713007e-1 )
WHEN "INCOME_ESTIMATE" > 9.96199e4 THEN 3.862983841507e-2
ELSE 3.862983841507e-2
END) AS DOUBLE)+
CAST( (CASE
WHEN ( "INCOME_CATEGORY" IS NULL ) THEN 5.565893990123e-2
WHEN "INCOME_CATEGORY" <= 1.4e1 THEN 1.644356619365e-2
WHEN "INCOME_CATEGORY" <= 1.5e1 THEN -5.172463870405e-3
WHEN "INCOME_CATEGORY" <= 2.5e1 THEN -2.678849393447e-2
WHEN "INCOME_CATEGORY" < 3.5e1 THEN -4.840452399853e-2
WHEN "INCOME_CATEGORY" <= 3.5e1 THEN -3.080518035501e-2
WHEN "INCOME_CATEGORY" <= 5.0e1 THEN -5.242121041907e-2
WHEN "INCOME_CATEGORY" < 7.5e1 THEN -7.403724048313e-2
WHEN "INCOME_CATEGORY" >= 7.5e1 THEN -7.586368865657e-2
ELSE -7.586368865657e-2
END) AS DOUBLE) )
) AS "SCORE" FROM "APL_SAMPLES"."AUTO_CLAIMS_NEW";
**********************************************************
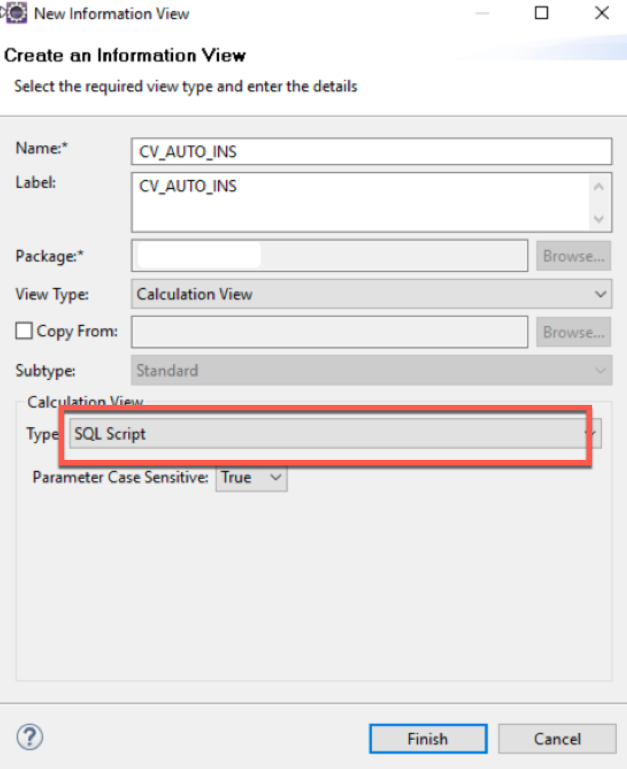
Create a SQLScript type calculation view in package where you have authorization to create calculation views.
From the autoins.sql file copy the select statement , add primary id or other additional fields that you want to see in the output along with the scoring information, then paste in the SQL console of HANA studio and execute.
Save and activate the view.

Select the calculation view and perform a data preview to see the scoring information on the new insurance claim data coming from the table “AUTO_INSURANCE_NEW”.

We will use this Calculation view in SAP Analytics Cloud visualization.
Using the Expert Analytics mode:
I will use SAP Predictive Analytics Expert Analytics mode to generate a model and use it in the SAP Analytics Cloud.

After run.

Now go back to the designer mode and export the model as a stored procedure.

Provide the name of the stored procedure and view.

In SAP HANA studio you will be able to see the stored procedure under the user schema.

Now create a CALC view of type SQL Script.

Call the stored procedure inside the SQL Script, save and activate the view.
You can use the exported procedure or call a HANA PAL algorithm directly (Time series forecasting smoothing as an example).

You can connect and consume the models (calculation view) generated by either Automated Analytics or Expert Analytics.

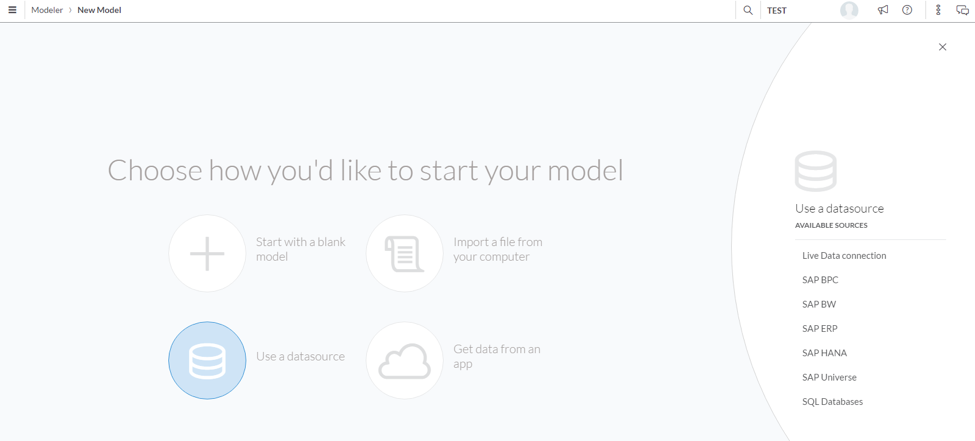
Log on to SAP Analytics Cloud-> Modeler->Models. Then Create new model.


Select live data source
Select the live data connection to the remote HANA system and specify the CALC view.

You can create stories using the CALC view as DS.
Select “CLAIM_ID” as dimension and “SCORE” as measure.

Sort the “SCORE” from highest to lowest.

This is how you can create a nice visualization on top of your on premise predictive models.
Business Requirement
Let’s consider a use case where CRM (Customer Relation Management) data in SAP HANA on premise system is required to predict the organizations revenue for next quarter. There after a nice visualization can be built in SAP Analytics Cloud for the business users. There is huge amount of value in this use case when you add in SAP Predictive Analytics data manager to do data preparation and automate the creation of the scores using Automated Analytics, as in this process the reports and stories in SAP Analytics Cloud are kept up to date.
Technical flow
SAP Predictive Analytics – Automated Analytics mode or Expert mode can be exploited to create predictive models on the data stored in SAP HANA. Then the SQL from Automated Analytics code generator or Stored Procedure exported from Expert Analytics can be embedded in a calculation view. An Apache HTTP server or SAP Web Dispatcher must be configured as a reverse proxy. Finally SAP Analytics Cloud can connect to calculation view using a live data connection.
Create SAP HANA live connection
Log on to SAP Analytics Cloud and create a new connection to the on-premise HANA system.
Provide the path of the HANA connection , UID and PW.
Hit the ok button to save the connection.
Create Predictive Model using SAP Predictive Analytics
Using the Automated Analytics mode
Open the Predictive Analytics Desktop tool.
- In this scenario, I will build a classification scenario on the auto insurance fraudulent claim data.
Next, I will specify the location of my training dataset from the SAP HANA system.
The dataset looks like below. In the table, You have all the historical claim information and TARGET field IS_FRAUD which marks the fraudulent claims from the past.
Now click on “Analyze” button to extract the metadata definition.
Select the independent and target variable, exclude any variable which can be highly co related with the target. For example, “Claim_ID”.
Finally generate the model.
- A classification model will be generated.
Click on the next button and go to the SAVE section of the modeler and choose “Generate Source Code” option.
- Generate a SQL code for SAP HANA, enter the primary key and the table name (application dataset) in the pop up and save the SQL in the local file. Here “AUTO_CLAIMS_NEW” are the new auto insurance claims and have to be scored by the model.
- The file will be saved in the local folder.
- Open the file copy the SQL code, paste it in the HANA studio SQL console and execute.
*******CODE FOR SCORING********************
SELECT claim_id,
(
( CAST( (CASE
WHEN ( "DAYS_TO_REPORT" IS NULL ) THEN 4.227952152315e-2
WHEN "DAYS_TO_REPORT" <= 0.0e0 THEN -1.046395403425e-1
WHEN "DAYS_TO_REPORT" <= 3.0e1 THEN ( -3.88853263231e-4*"DAYS_TO_REPORT"+4.733461394449e-2 )
ELSE 3.566901604756e-2
END) AS DOUBLE)+
CAST( (CASE
WHEN ( "BODILY_INJURY_AMOUNT" IS NULL ) THEN 2.791690244322e-1
WHEN "BODILY_INJURY_AMOUNT" <= 0.0e0 THEN -7.531522221077e-2
WHEN "BODILY_INJURY_AMOUNT" <= 3.5e1 THEN ( 9.137299945372e-6*"BODILY_INJURY_AMOUNT"-7.531522221074e-2 )
WHEN "BODILY_INJURY_AMOUNT" <= 3.6e1 THEN 9.187587116978e-2
WHEN "BODILY_INJURY_AMOUNT" <= 6.5e1 THEN ( 5.635347517772e-3*"BODILY_INJURY_AMOUNT"-1.109966394533e-1 )
WHEN "BODILY_INJURY_AMOUNT" <= 2.9694e4 THEN ( 9.137299945373e-6*"BODILY_INJURY_AMOUNT"+2.584090789814e-1 )
ELSE 5.297320635593e-1
END) AS DOUBLE)+
CAST( (CASE
WHEN ( "PROPERTY_DAMAGE" IS NULL ) THEN 3.102307096193e-2
WHEN "PROPERTY_DAMAGE" <= 2.8e1 THEN 1.938519862852e-2
WHEN "PROPERTY_DAMAGE" <= 1.057e3 THEN ( -9.797125087338e-7*"PROPERTY_DAMAGE"+1.941263057866e-2 )
WHEN "PROPERTY_DAMAGE" <= 1.059e3 THEN ( 8.09669314255e-3*"PROPERTY_DAMAGE"-8.5476743297e0 )
WHEN "PROPERTY_DAMAGE" <= 1.066e3 THEN ( 1.131025375949e-3*"PROPERTY_DAMAGE"-1.171032164869e0 )
WHEN "PROPERTY_DAMAGE" <= 2.117e3 THEN ( -9.239319573994e-7*"PROPERTY_DAMAGE"+3.605033404677e-2 )
WHEN "PROPERTY_DAMAGE" <= 3.995e3 THEN ( -9.173027585123e-7*"PROPERTY_DAMAGE"+3.603630003264e-2 )
WHEN "PROPERTY_DAMAGE" <= 6.546e3 THEN ( -1.0026833878e-6*"PROPERTY_DAMAGE"+3.637740025266e-2 )
WHEN "PROPERTY_DAMAGE" <= 6.61e3 THEN ( -3.783067033567e-5*"PROPERTY_DAMAGE"+2.774645706781e-1 )
WHEN "PROPERTY_DAMAGE" <= 6.648e3 THEN ( -6.202429689291e-5*"PROPERTY_DAMAGE"+4.373844422212e-1 )
WHEN "PROPERTY_DAMAGE" <= 4.5062e4 THEN ( -9.797125087338e-7*"PROPERTY_DAMAGE"+3.153245296781e-2 )
ELSE -1.261535210075e-2
END) AS DOUBLE)+
CAST( (CASE
WHEN ( "PAYMENT_METHOD" IS NULL OR "PAYMENT_METHOD" = '' ) THEN 3.680824732156e-2
WHEN "PAYMENT_METHOD" IN('CC') THEN 1.92163467088e-2
ELSE 3.680824732156e-2
END) AS DOUBLE)+
CAST( (CASE
WHEN ( "PREM_AMOUNT" IS NULL OR "PREM_AMOUNT" = '' ) THEN 3.746951801366e-2
WHEN "PREM_AMOUNT" IN('Safedriving_discount') THEN -1.634747595275e-3
ELSE 3.746951801366e-2
END) AS DOUBLE)+
CAST( (CASE
WHEN ( "AGE" IS NULL ) THEN 3.500244704649e-3
WHEN "AGE" <= 1.8e1 THEN 7.838834046102e-2
WHEN "AGE" <= 3.9e1 THEN ( -6.313441003348e-4*"AGE"+8.975253426565e-2 )
WHEN "AGE" <= 4.0e1 THEN 6.721540071162e-2
WHEN "AGE" <= 4.7e1 THEN ( -2.886755258385e-4*"AGE"+7.876242174494e-2 )
WHEN "AGE" <= 4.9e1 THEN ( 1.810515826793e-2*"AGE"-8.028147751493e-1 )
WHEN "AGE" <= 5.0e1 THEN ( 1.39968738011e-2*"AGE"-6.015088362726e-1 )
WHEN "AGE" <= 5.1e1 THEN 1.123317275852e-1
WHEN "AGE" <= 5.2e1 THEN 1.167689138613e-1
WHEN "AGE" <= 5.3e1 THEN 5.626550532057e-2
WHEN "AGE" <= 5.9e1 THEN ( -1.530054659884e-3*"AGE"+9.224341497777e-2 )
WHEN "AGE" <= 9.7e1 THEN ( -6.313441003348e-4*"AGE"+3.434738525709e-2 )
ELSE -2.689299247539e-2
END) AS DOUBLE)+
CAST( (CASE
WHEN ( "GENDER" IS NULL OR "GENDER" = '' ) THEN 2.595670445824e-2
WHEN "GENDER" IN('Female') THEN 2.746981982479e-2
ELSE 2.595670445824e-2
END) AS DOUBLE)+
CAST( (CASE
WHEN ( "INCOME_ESTIMATE" IS NULL ) THEN -1.100620855926e-2
WHEN "INCOME_ESTIMATE" <= 1.10284e2 THEN 2.466483632029e-2
WHEN "INCOME_ESTIMATE" <= 2.013945104213e4 THEN ( 1.765169506452e-6*"INCOME_ESTIMATE"+2.447016636997e-2 )
WHEN "INCOME_ESTIMATE" <= 2.01595e4 THEN ( 1.790305369523e-3*"INCOME_ESTIMATE"-3.599574762874e1 )
WHEN "INCOME_ESTIMATE" <= 2.239818046358e4 THEN ( 1.778280476528e-5*"INCOME_ESTIMATE"-2.625789844961e-1 )
WHEN "INCOME_ESTIMATE" <= 2.463686092715e4 THEN ( 1.778280476528e-5*"INCOME_ESTIMATE"-2.625789844921e-1 )
WHEN "INCOME_ESTIMATE" <= 2.786778612847e4 THEN ( -9.333313092882e-6*"INCOME_ESTIMATE"+4.054770400606e-1 )
WHEN "INCOME_ESTIMATE" <= 2.93686e4 THEN ( -4.96704225229e-5*"INCOME_ESTIMATE"+1.52958297869e0 )
WHEN "INCOME_ESTIMATE" <= 3.596061268238e4 THEN ( -9.945252443153e-6*"INCOME_ESTIMATE"+3.629103486791e-1 )
WHEN "INCOME_ESTIMATE" <= 4.88414e4 THEN ( -1.301901238443e-6*"INCOME_ESTIMATE"+5.209014372709e-2 )
WHEN "INCOME_ESTIMATE" <= 4.889217850241e4 THEN ( -7.762468646546e-4*"INCOME_ESTIMATE"+3.790148707992e1 )
WHEN "INCOME_ESTIMATE" <= 9.96199e4 THEN ( 1.765169506452e-6*"INCOME_ESTIMATE"-1.372161713007e-1 )
WHEN "INCOME_ESTIMATE" > 9.96199e4 THEN 3.862983841507e-2
ELSE 3.862983841507e-2
END) AS DOUBLE)+
CAST( (CASE
WHEN ( "INCOME_CATEGORY" IS NULL ) THEN 5.565893990123e-2
WHEN "INCOME_CATEGORY" <= 1.4e1 THEN 1.644356619365e-2
WHEN "INCOME_CATEGORY" <= 1.5e1 THEN -5.172463870405e-3
WHEN "INCOME_CATEGORY" <= 2.5e1 THEN -2.678849393447e-2
WHEN "INCOME_CATEGORY" < 3.5e1 THEN -4.840452399853e-2
WHEN "INCOME_CATEGORY" <= 3.5e1 THEN -3.080518035501e-2
WHEN "INCOME_CATEGORY" <= 5.0e1 THEN -5.242121041907e-2
WHEN "INCOME_CATEGORY" < 7.5e1 THEN -7.403724048313e-2
WHEN "INCOME_CATEGORY" >= 7.5e1 THEN -7.586368865657e-2
ELSE -7.586368865657e-2
END) AS DOUBLE) )
) AS "SCORE" FROM "APL_SAMPLES"."AUTO_CLAIMS_NEW";
**********************************************************
Create a SQLScript type calculation view in package where you have authorization to create calculation views.
From the autoins.sql file copy the select statement , add primary id or other additional fields that you want to see in the output along with the scoring information, then paste in the SQL console of HANA studio and execute.
Save and activate the view.
Select the calculation view and perform a data preview to see the scoring information on the new insurance claim data coming from the table “AUTO_INSURANCE_NEW”.
We will use this Calculation view in SAP Analytics Cloud visualization.
Using the Expert Analytics mode:
I will use SAP Predictive Analytics Expert Analytics mode to generate a model and use it in the SAP Analytics Cloud.
- Connect to HANA system by clicking on file new -> online HANA connection, then select the input table for training .
- Drag and drop a PAL function from right-hand pane and configure the function , then run the analysis.
After run.
Now go back to the designer mode and export the model as a stored procedure.
Provide the name of the stored procedure and view.
In SAP HANA studio you will be able to see the stored procedure under the user schema.
Now create a CALC view of type SQL Script.
Call the stored procedure inside the SQL Script, save and activate the view.
You can use the exported procedure or call a HANA PAL algorithm directly (Time series forecasting smoothing as an example).
Consume the Predictive Models in SAP Analytics Cloud
You can connect and consume the models (calculation view) generated by either Automated Analytics or Expert Analytics.
Log on to SAP Analytics Cloud-> Modeler->Models. Then Create new model.
Select live data source
Select the live data connection to the remote HANA system and specify the CALC view.
You can create stories using the CALC view as DS.
- At the end you can create a visualization or a story in SAP Analytics Cloud.
Select “CLAIM_ID” as dimension and “SCORE” as measure.
Sort the “SCORE” from highest to lowest.
This is how you can create a nice visualization on top of your on premise predictive models.
- SAP Managed Tags:
- SAP Analytics Cloud,
- SAP Predictive Analytics
You must be a registered user to add a comment. If you've already registered, sign in. Otherwise, register and sign in.
Labels in this area
-
ABAP CDS Views - CDC (Change Data Capture)
2 -
AI
1 -
Analyze Workload Data
1 -
BTP
1 -
Business and IT Integration
2 -
Business application stu
1 -
Business Technology Platform
1 -
Business Trends
1,661 -
Business Trends
87 -
CAP
1 -
cf
1 -
Cloud Foundry
1 -
Confluent
1 -
Customer COE Basics and Fundamentals
1 -
Customer COE Latest and Greatest
3 -
Customer Data Browser app
1 -
Data Analysis Tool
1 -
data migration
1 -
data transfer
1 -
Datasphere
2 -
Event Information
1,400 -
Event Information
64 -
Expert
1 -
Expert Insights
178 -
Expert Insights
273 -
General
1 -
Google cloud
1 -
Google Next'24
1 -
Kafka
1 -
Life at SAP
784 -
Life at SAP
11 -
Migrate your Data App
1 -
MTA
1 -
Network Performance Analysis
1 -
NodeJS
1 -
PDF
1 -
POC
1 -
Product Updates
4,577 -
Product Updates
326 -
Replication Flow
1 -
RisewithSAP
1 -
SAP BTP
1 -
SAP BTP Cloud Foundry
1 -
SAP Cloud ALM
1 -
SAP Cloud Application Programming Model
1 -
SAP Datasphere
2 -
SAP S4HANA Cloud
1 -
SAP S4HANA Migration Cockpit
1 -
Technology Updates
6,886 -
Technology Updates
403 -
Workload Fluctuations
1
Related Content
- Deep dive into Q4 2023, What’s New in SAP Cloud ALM for Implementation Blog Series in Technology Blogs by SAP
- ML- Linear Regression definition , implementation scenarios in HANA in Technology Blogs by Members
- Pilot: SAP Datasphere Fundamentals in Technology Blogs by SAP
- Planning Professional vs Planning standard Capabilities in Technology Q&A
- SAP SAC Live Connection in Technology Q&A
Top kudoed authors
| User | Count |
|---|---|
| 12 | |
| 10 | |
| 9 | |
| 7 | |
| 7 | |
| 7 | |
| 6 | |
| 6 | |
| 5 | |
| 4 |