SAP Analytics Cloud R Visualization feature allows users to integrate their own R environment into SAP Analytics Cloud. R is an open-source programming language that includes packages for advanced visualizations, Statistics, Machine Learning and much more.
With this new integration in SAP Analytics Cloud, you can now:
- Insert R-visualizations into your story
- Interact with R-visualizations using SAP Analytics Cloud-controls (such as filters)
- Share these SAP Analytics Cloud stories, which include R-visualizations, with other users.
With the R visualization capability, users are able to perform statistical and analytical analyses and create truly captivating visuals to reflect these analyses. Also, it is important to note that these visualizations remain interactive and consider the row-level security of users.
In this blog, we will focus on preparing the model and data for the Sales Analysis we want to do with R Visualization.
Prerequisites:
In order to perform the analysis with R visualization, you will need to set up and configure your R Server to connect to SAP Analytics Cloud. Please refer to
this blog for the detailed steps to set up your R server connection.
Now we can go ahead to prepare the model you will need to do the R Visualization. You will need to download the model file SoftwareSales_ABCCompany_Model.xlsx and the data file SoftwareSales_ABCCompany_Data.csv
here:
Create Model:
As the first step, we need to create a Sales model that has the following dimensions (Please make sure your dimension description is same as the list below):
- Accounts ABCCompany
- Customer Names ABCCompany
- Customer Segments ABCCompany
- Customer Sectors ABCCompany
- Sales Regions ABCCompany
- Time (created automatically during model generation)
- Login to SAC, and go to Create -> Model

- In the next page, choose to create a blank model

- Enter the model name and description and click OK. Make sure you click "Enable Planning" Option.

- Make adjustment of your time dimension horizon to include periods between 2012 - 2016. And make sure the Lowest Granularity is set to Day level.

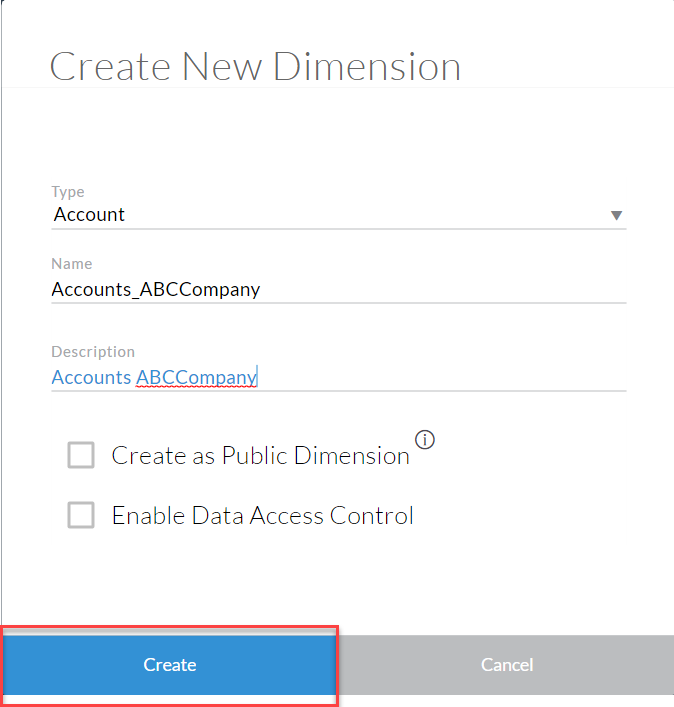
- Now we need to create the dimensions. Let's start with account dimension. Go to Account - Create new Dimension.

- Choose dimesion type "Account", enter the dimension name and description.
- Open the Excel File SoftwareSales_ABCCompany_Model.xlsx, and navigate to the first tab. Copy the content except for the first row.

- Paste the content into the Account dimension in Analytics Cloud, fix any highlighted error.

- Repeat Step 5 - 8 and create the rest of dimensions. (Choose Organization as dimension type for Region, and Generic as dimension type for other dimensions).
- Click Save to save the model.

Import Data:
Now we need to import the sales data into the model we just created.
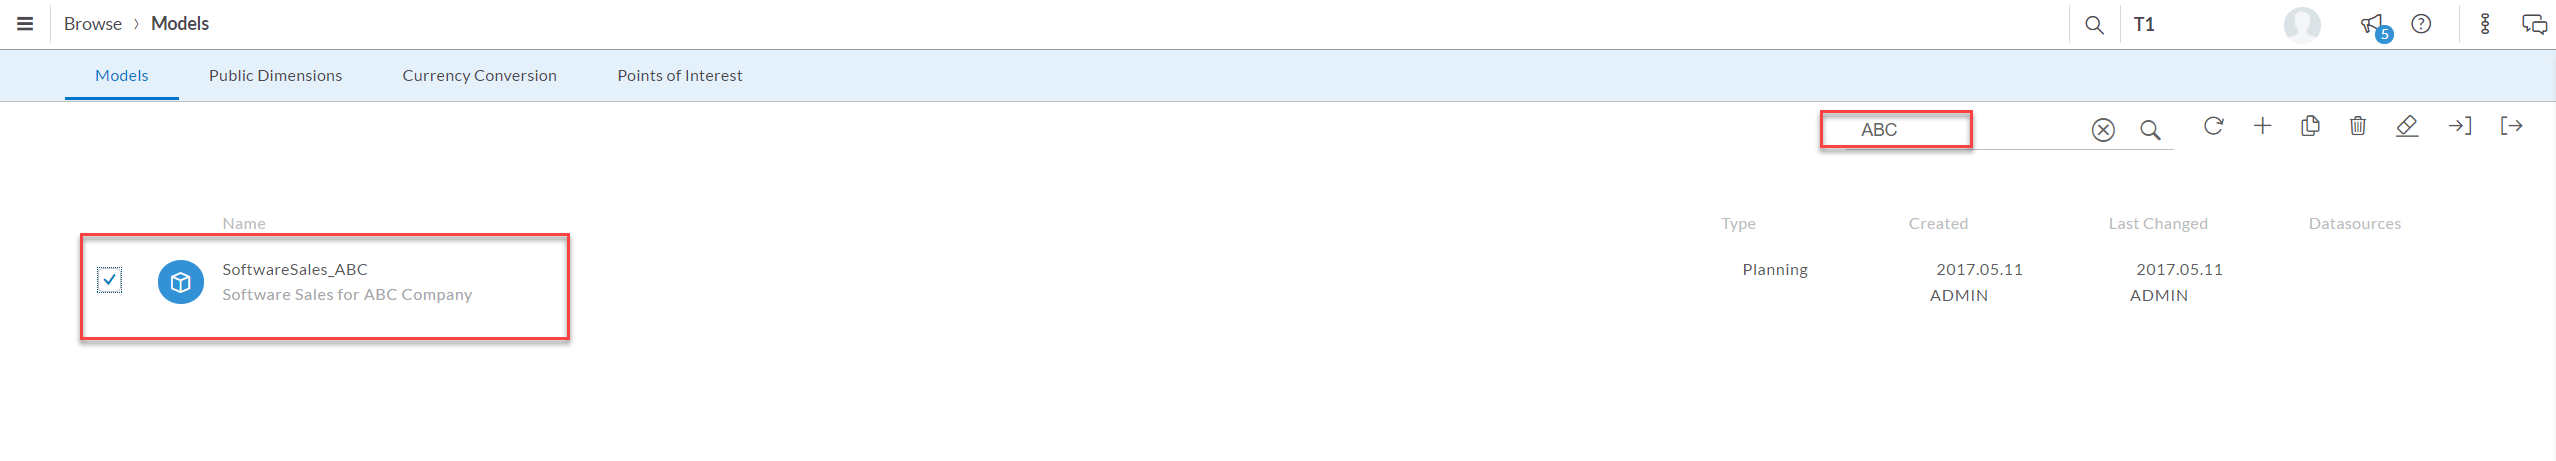
- Go to Modeler page.

- Find the model we just created and Select it.
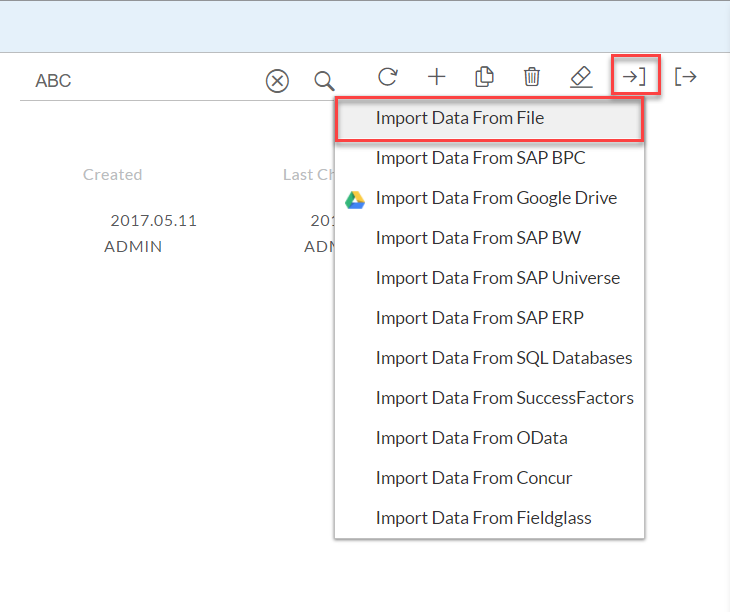
- Choose to import data to the model from file
- On the pop-up window, browse and select file SoftwareSales_ABCCompany_Data.csv, and click Import.


- You will then land on the wrangling page. Choose the yearMonth Column and set the time format to MM/DD/YYYY.

- Choose the first unmatched column and match it to Measure.

- On the pop-up window, choose "Sales software On Premise" and click OK.

- Repeat step 5-6 to finish mapping the remaining unmatched columns to Sales Software Cloud, Sales Service Consulting, and Sales Service Customer Success.
- Go to "View Model Details" - View all option and make sure the options are selected as shown below.

- After everything is matched, click Finish Mapping to import the data

Now, we have finished all the preparation steps for us to start doing sales analysis with SAP Analytics Cloud R Visualization. See part II of the blog on SAP for an example (and step-by-step guide) of both a
- Detailed analysis of Sales/Cost Trend via time (where the analyst wants to explore the sales trend over time for software and service in order to leverage its data with R visualization.)
- Detailed Customer Analysis (where the analyst wants to see the details of the company’s customer base and how it changes over time-based on different measures).
These examples help illustrate how to leverage the R-Visualization feature of SAP Analytics Cloud to do the real business analysis. As we can see, the feature is able to provide a lot more flexibility on visualization and business intelligence.
