
- SAP Community
- Products and Technology
- Technology
- Technology Blogs by Members
- Predictive Analytics in SAP Business Objects Cloud...
Technology Blogs by Members
Explore a vibrant mix of technical expertise, industry insights, and tech buzz in member blogs covering SAP products, technology, and events. Get in the mix!
Turn on suggestions
Auto-suggest helps you quickly narrow down your search results by suggesting possible matches as you type.
Showing results for
former_member30
Explorer
Options
- Subscribe to RSS Feed
- Mark as New
- Mark as Read
- Bookmark
- Subscribe
- Printer Friendly Page
- Report Inappropriate Content
06-11-2017
8:15 PM
SAP has provided a “Smart Discovery” functionality in Business Objects Cloud targeting business users to help them get insights from data in the form of easy to understand charts and statements. To derive these insights BoBJ Cloud chooses, in the background, the predictive algorithm best fit for the model and data .Since the algorithm selection and execution is happening in the background any business user can derive these insights in a matter of minutes and without any knowledge of data science or complex predictive algorithms.
I decided to try “Smart Discovery” by building something in the system. I always find it better if I can build something and then play around with it to try out the various functionalities .It also helps me better retain the concept. So like my previous blogs I will share the data and the steps that I used so that you can execute the steps yourself. You can download the data from https://drive.google.com/open?id=0B0ETLJHyKCEFbEZIVFhfa1Q3dEk
The dataset you downloaded has the sales figures of retail products which have historically seen some changes in sales with changes in weather conditions. These could be products like umbrellas, raincoats, rain boots, sun glasses, thermal wear, flip flops etc., for eight days for a set of stores in different cities .We also have the weather data i.e. temperature, air quality and humidity for each of the cities for the eight days .
We want to investigate how the change in weather conditions has an impact on the sales of these products. For e.g. how hot does it have to get for people to start buying sun glasses? How many sun glasses can I expect to sell based on which I can decide on how many to stock?
If we tried to do this on our own by identifying an algorithms, loading and modelling the data this would take a considerable amount of time and require the involvement of data scientists, data engineers and so on. With BoBJ Cloud we can find these insights in under 5 minutes.
We will import the data and let the system create the best most optimum model for us.Creating the model for this case is very straightforward. Use “Import a file from your computer”

Click on "Select Source File" in Blue and select the file from your desktop. BoBJ Cloud does the remaining for you like identifying what kind of file it is..

Read this "Data Sample" for information and press “OK”

After verifying that you got your dimensions, measures and date fields as expected click on “Create Model” and in about 30 seconds your model is ready.

Next “Create story” --> Add a Canvas Page-->Table and select the model you just created as data source

In the story that opens up select a few dimensions in the row and save the story. Then click on “Data View”

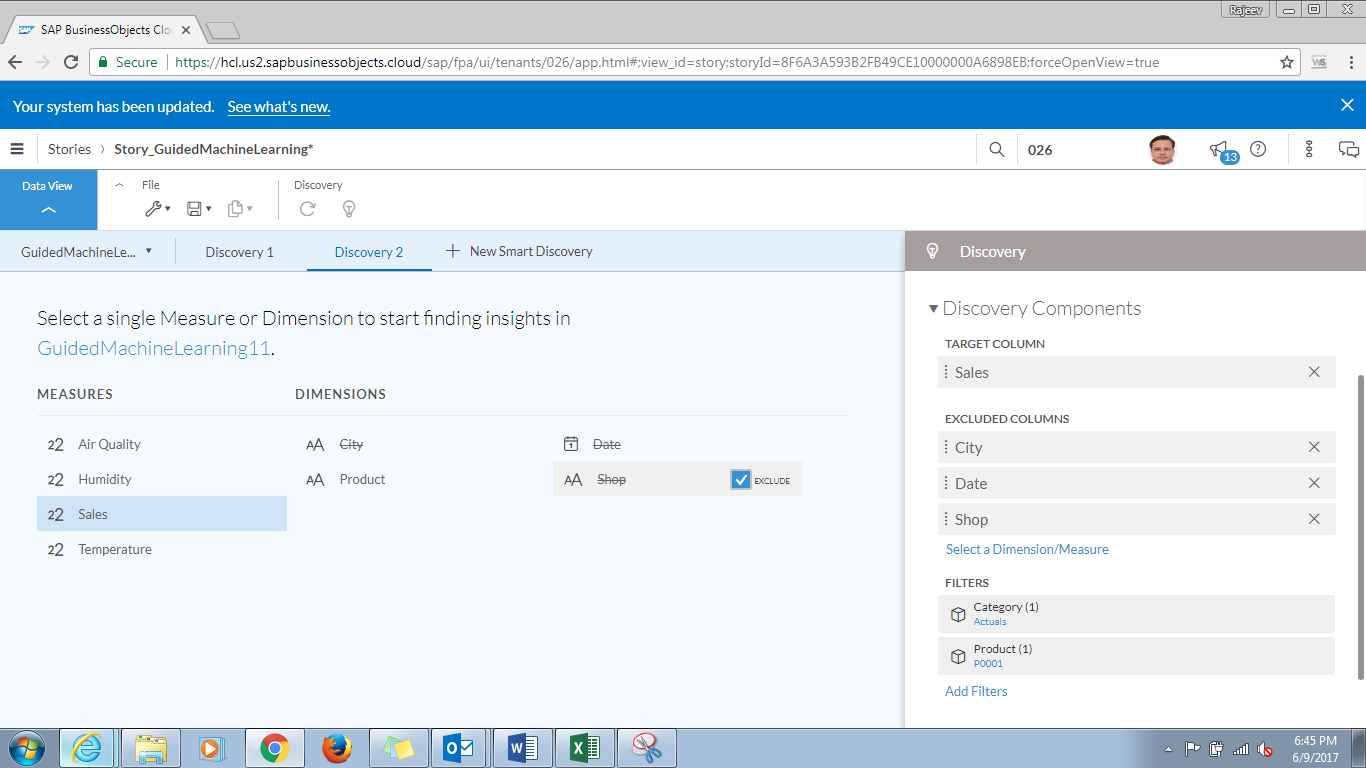
On the next page select “New Smart Discovery”

On the next page double click on “Sales”. The field that you click first becomes the “Target Column”. Exclude Date, City and Shop as we only want to see the impact of change of weather on sales of a product.
To help better understand “Guided Machine Discovery” let’s take only a single product “P0001”.
Once you have executed the steps your page will look like this.
Click “Run”. After that it may take a few seconds for the output to come up.

First thing you will see in the output right on top is the metadata about the run.

An “insight quality” of 5/5 is excellent though with a large dataset we may not be able to achieve 5/5.The good thing with GMD is that it will tell you if it thinks the data quality is not good enough and then you will have the option to continue with the low insight quality or add more fields to improve quality.

The picture above is for illustration purpose only. If you have followed the steps in the blog you will not get this message.
The algorithm identify and then executed at the backend was able to identify only two key influencers impacting sales of P0001 i.e. temperature and Air Quality with temperature being the main influencer.
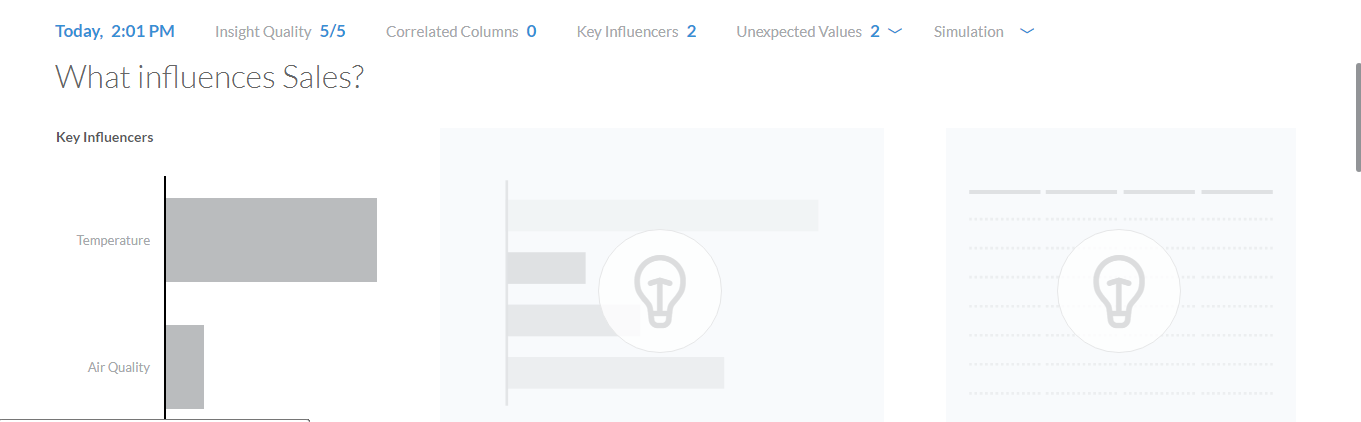
On clicking on any of the key influencers you can see the relation of the key influencer with the target column in a horizontal bar chart. You can flip between “Averages” and “Count” .And more importantly you can see the derived insights to help you make better decisions.

The second insight i.e. “100.00% of Records with Temperature (109.00-119.00) have above average sales” tells me that most sales for this product happens when the temperatures are high.
The reducing sales in the bar chart with the falling temperature help me infer the same again.
Now I want to look into how both Temperature and Air Quality together impact sales. For this select “Air Quality” in the first horizontal bar chart under “Key Influencers”. Now when you scroll down you will find a heat map showing the relation between the three with insights on the right.

The consistent dark color areas at high temperature in the heat map help us infer that Air quality has very less to no impact on the sales of this product.
As seen in the metadata there are two unexpected values and we would like to look into these records and analyze them. Click in the show unexpected values.

And the definition of unexpected values that I found in BoBJ Cloud is crisp and to the point so I will just use that.

The table has the two records and the details

And the line and the bar charts below the table help us understand better
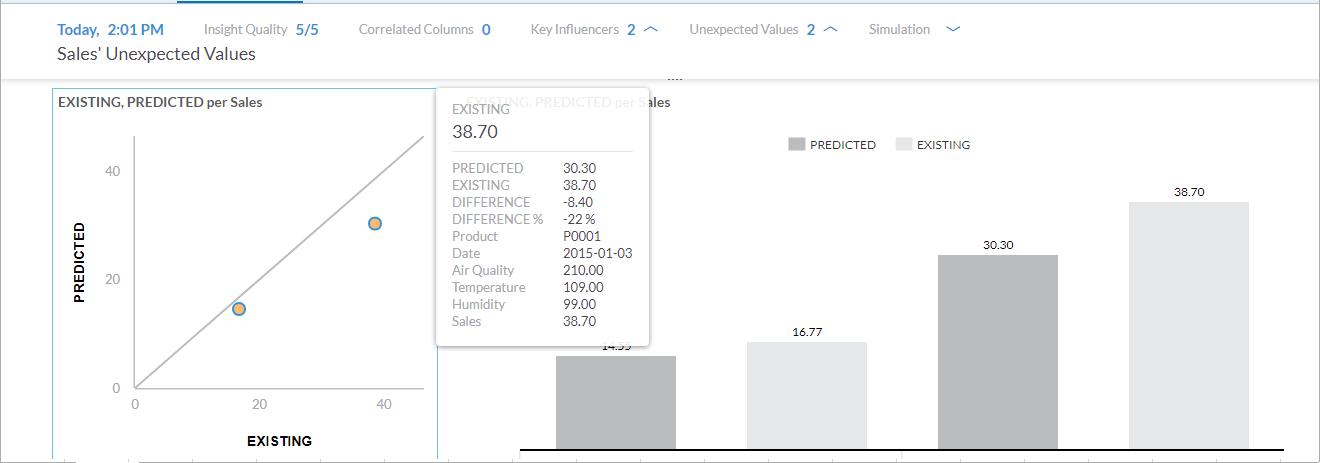
So if we look into the first record of the table the algorithm was expecting a sales of 14.55 but the sales was 13% higher at 16.77 so the system decided that these values were not normal or outliers.
Simulation which you will find right at the bottom is also the most interesting.

As you change the temperature and/or air quality you can see how much sales you can expect. If there were some dimensions in our analysis you will get radio button drop downs for the same.
In our case, as a test, if we increase air quality the sales should not increase by much which we can see is true.

You can select any chart or insight/table and copy it to your story. In case you ass more data and rerun the discovery then you will have to delete the old graph from the story and paste the new one. The old graphs do not change to accommodate the old discovery.

I decided to try “Smart Discovery” by building something in the system. I always find it better if I can build something and then play around with it to try out the various functionalities .It also helps me better retain the concept. So like my previous blogs I will share the data and the steps that I used so that you can execute the steps yourself. You can download the data from https://drive.google.com/open?id=0B0ETLJHyKCEFbEZIVFhfa1Q3dEk
The Dataset
The dataset you downloaded has the sales figures of retail products which have historically seen some changes in sales with changes in weather conditions. These could be products like umbrellas, raincoats, rain boots, sun glasses, thermal wear, flip flops etc., for eight days for a set of stores in different cities .We also have the weather data i.e. temperature, air quality and humidity for each of the cities for the eight days .
What insights are we looking for?
We want to investigate how the change in weather conditions has an impact on the sales of these products. For e.g. how hot does it have to get for people to start buying sun glasses? How many sun glasses can I expect to sell based on which I can decide on how many to stock?
If we tried to do this on our own by identifying an algorithms, loading and modelling the data this would take a considerable amount of time and require the involvement of data scientists, data engineers and so on. With BoBJ Cloud we can find these insights in under 5 minutes.
Lets create the Model by Importing the Data
We will import the data and let the system create the best most optimum model for us.Creating the model for this case is very straightforward. Use “Import a file from your computer”
Click on "Select Source File" in Blue and select the file from your desktop. BoBJ Cloud does the remaining for you like identifying what kind of file it is..
Read this "Data Sample" for information and press “OK”
After verifying that you got your dimensions, measures and date fields as expected click on “Create Model” and in about 30 seconds your model is ready.
Creating the story
Next “Create story” --> Add a Canvas Page-->Table and select the model you just created as data source
In the story that opens up select a few dimensions in the row and save the story. Then click on “Data View”
Now let’s do some "Smart Discovery"
On the next page select “New Smart Discovery”
On the next page double click on “Sales”. The field that you click first becomes the “Target Column”. Exclude Date, City and Shop as we only want to see the impact of change of weather on sales of a product.
To help better understand “Guided Machine Discovery” let’s take only a single product “P0001”.
Once you have executed the steps your page will look like this.
Click “Run”. After that it may take a few seconds for the output to come up.
The output
First thing you will see in the output right on top is the metadata about the run.
Insight Quality
An “insight quality” of 5/5 is excellent though with a large dataset we may not be able to achieve 5/5.The good thing with GMD is that it will tell you if it thinks the data quality is not good enough and then you will have the option to continue with the low insight quality or add more fields to improve quality.
The picture above is for illustration purpose only. If you have followed the steps in the blog you will not get this message.
Key Influencers
The algorithm identify and then executed at the backend was able to identify only two key influencers impacting sales of P0001 i.e. temperature and Air Quality with temperature being the main influencer.
On clicking on any of the key influencers you can see the relation of the key influencer with the target column in a horizontal bar chart. You can flip between “Averages” and “Count” .And more importantly you can see the derived insights to help you make better decisions.
The second insight i.e. “100.00% of Records with Temperature (109.00-119.00) have above average sales” tells me that most sales for this product happens when the temperatures are high.
The reducing sales in the bar chart with the falling temperature help me infer the same again.
Now I want to look into how both Temperature and Air Quality together impact sales. For this select “Air Quality” in the first horizontal bar chart under “Key Influencers”. Now when you scroll down you will find a heat map showing the relation between the three with insights on the right.
The consistent dark color areas at high temperature in the heat map help us infer that Air quality has very less to no impact on the sales of this product.
Unexpected Values
As seen in the metadata there are two unexpected values and we would like to look into these records and analyze them. Click in the show unexpected values.
And the definition of unexpected values that I found in BoBJ Cloud is crisp and to the point so I will just use that.
The table has the two records and the details
And the line and the bar charts below the table help us understand better
So if we look into the first record of the table the algorithm was expecting a sales of 14.55 but the sales was 13% higher at 16.77 so the system decided that these values were not normal or outliers.
Simulation
Simulation which you will find right at the bottom is also the most interesting.
As you change the temperature and/or air quality you can see how much sales you can expect. If there were some dimensions in our analysis you will get radio button drop downs for the same.
In our case, as a test, if we increase air quality the sales should not increase by much which we can see is true.
You can select any chart or insight/table and copy it to your story. In case you ass more data and rerun the discovery then you will have to delete the old graph from the story and paste the new one. The old graphs do not change to accommodate the old discovery.
- SAP Managed Tags:
- SAP Analytics Cloud,
- SAP Predictive Analytics,
- SAP NetWeaver
You must be a registered user to add a comment. If you've already registered, sign in. Otherwise, register and sign in.
Labels in this area
-
"automatische backups"
1 -
"regelmäßige sicherung"
1 -
"TypeScript" "Development" "FeedBack"
1 -
505 Technology Updates 53
1 -
ABAP
14 -
ABAP API
1 -
ABAP CDS Views
2 -
ABAP CDS Views - BW Extraction
1 -
ABAP CDS Views - CDC (Change Data Capture)
1 -
ABAP class
2 -
ABAP Cloud
2 -
ABAP Development
5 -
ABAP in Eclipse
1 -
ABAP Platform Trial
1 -
ABAP Programming
2 -
abap technical
1 -
absl
2 -
access data from SAP Datasphere directly from Snowflake
1 -
Access data from SAP datasphere to Qliksense
1 -
Accrual
1 -
action
1 -
adapter modules
1 -
Addon
1 -
Adobe Document Services
1 -
ADS
1 -
ADS Config
1 -
ADS with ABAP
1 -
ADS with Java
1 -
ADT
2 -
Advance Shipping and Receiving
1 -
Advanced Event Mesh
3 -
AEM
1 -
AI
7 -
AI Launchpad
1 -
AI Projects
1 -
AIML
9 -
Alert in Sap analytical cloud
1 -
Amazon S3
1 -
Analytical Dataset
1 -
Analytical Model
1 -
Analytics
1 -
Analyze Workload Data
1 -
annotations
1 -
API
1 -
API and Integration
3 -
API Call
2 -
Application Architecture
1 -
Application Development
5 -
Application Development for SAP HANA Cloud
3 -
Applications and Business Processes (AP)
1 -
Artificial Intelligence
1 -
Artificial Intelligence (AI)
5 -
Artificial Intelligence (AI) 1 Business Trends 363 Business Trends 8 Digital Transformation with Cloud ERP (DT) 1 Event Information 462 Event Information 15 Expert Insights 114 Expert Insights 76 Life at SAP 418 Life at SAP 1 Product Updates 4
1 -
Artificial Intelligence (AI) blockchain Data & Analytics
1 -
Artificial Intelligence (AI) blockchain Data & Analytics Intelligent Enterprise
1 -
Artificial Intelligence (AI) blockchain Data & Analytics Intelligent Enterprise Oil Gas IoT Exploration Production
1 -
Artificial Intelligence (AI) blockchain Data & Analytics Intelligent Enterprise sustainability responsibility esg social compliance cybersecurity risk
1 -
ASE
1 -
ASR
2 -
ASUG
1 -
Attachments
1 -
Authorisations
1 -
Automating Processes
1 -
Automation
2 -
aws
2 -
Azure
1 -
Azure AI Studio
1 -
B2B Integration
1 -
Backorder Processing
1 -
Backup
1 -
Backup and Recovery
1 -
Backup schedule
1 -
BADI_MATERIAL_CHECK error message
1 -
Bank
1 -
BAS
1 -
basis
2 -
Basis Monitoring & Tcodes with Key notes
2 -
Batch Management
1 -
BDC
1 -
Best Practice
1 -
bitcoin
1 -
Blockchain
3 -
bodl
1 -
BOP in aATP
1 -
BOP Segments
1 -
BOP Strategies
1 -
BOP Variant
1 -
BPC
1 -
BPC LIVE
1 -
BTP
12 -
BTP Destination
2 -
Business AI
1 -
Business and IT Integration
1 -
Business application stu
1 -
Business Application Studio
1 -
Business Architecture
1 -
Business Communication Services
1 -
Business Continuity
1 -
Business Data Fabric
3 -
Business Partner
12 -
Business Partner Master Data
10 -
Business Technology Platform
2 -
Business Trends
4 -
CA
1 -
calculation view
1 -
CAP
3 -
Capgemini
1 -
CAPM
1 -
Catalyst for Efficiency: Revolutionizing SAP Integration Suite with Artificial Intelligence (AI) and
1 -
CCMS
2 -
CDQ
12 -
CDS
2 -
Cental Finance
1 -
Certificates
1 -
CFL
1 -
Change Management
1 -
chatbot
1 -
chatgpt
3 -
CL_SALV_TABLE
2 -
Class Runner
1 -
Classrunner
1 -
Cloud ALM Monitoring
1 -
Cloud ALM Operations
1 -
cloud connector
1 -
Cloud Extensibility
1 -
Cloud Foundry
4 -
Cloud Integration
6 -
Cloud Platform Integration
2 -
cloudalm
1 -
communication
1 -
Compensation Information Management
1 -
Compensation Management
1 -
Compliance
1 -
Compound Employee API
1 -
Configuration
1 -
Connectors
1 -
Consolidation Extension for SAP Analytics Cloud
2 -
Control Indicators.
1 -
Controller-Service-Repository pattern
1 -
Conversion
1 -
Cosine similarity
1 -
cryptocurrency
1 -
CSI
1 -
ctms
1 -
Custom chatbot
3 -
Custom Destination Service
1 -
custom fields
1 -
Customer Experience
1 -
Customer Journey
1 -
Customizing
1 -
cyber security
3 -
Data
1 -
Data & Analytics
1 -
Data Aging
1 -
Data Analytics
2 -
Data and Analytics (DA)
1 -
Data Archiving
1 -
Data Back-up
1 -
Data Governance
5 -
Data Integration
2 -
Data Quality
12 -
Data Quality Management
12 -
Data Synchronization
1 -
data transfer
1 -
Data Unleashed
1 -
Data Value
8 -
database tables
1 -
Datasphere
2 -
datenbanksicherung
1 -
dba cockpit
1 -
dbacockpit
1 -
Debugging
2 -
Delimiting Pay Components
1 -
Delta Integrations
1 -
Destination
3 -
Destination Service
1 -
Developer extensibility
1 -
Developing with SAP Integration Suite
1 -
Devops
1 -
digital transformation
1 -
Documentation
1 -
Dot Product
1 -
DQM
1 -
dump database
1 -
dump transaction
1 -
e-Invoice
1 -
E4H Conversion
1 -
Eclipse ADT ABAP Development Tools
2 -
edoc
1 -
edocument
1 -
ELA
1 -
Embedded Consolidation
1 -
Embedding
1 -
Embeddings
1 -
Employee Central
1 -
Employee Central Payroll
1 -
Employee Central Time Off
1 -
Employee Information
1 -
Employee Rehires
1 -
Enable Now
1 -
Enable now manager
1 -
endpoint
1 -
Enhancement Request
1 -
Enterprise Architecture
1 -
ETL Business Analytics with SAP Signavio
1 -
Euclidean distance
1 -
Event Dates
1 -
Event Driven Architecture
1 -
Event Mesh
2 -
Event Reason
1 -
EventBasedIntegration
1 -
EWM
1 -
EWM Outbound configuration
1 -
EWM-TM-Integration
1 -
Existing Event Changes
1 -
Expand
1 -
Expert
2 -
Expert Insights
2 -
Fiori
14 -
Fiori Elements
2 -
Fiori SAPUI5
12 -
Flask
1 -
Full Stack
8 -
Funds Management
1 -
General
1 -
Generative AI
1 -
Getting Started
1 -
GitHub
8 -
Grants Management
1 -
groovy
1 -
GTP
1 -
HANA
6 -
HANA Cloud
2 -
Hana Cloud Database Integration
2 -
HANA DB
2 -
HANA XS Advanced
1 -
Historical Events
1 -
home labs
1 -
HowTo
1 -
HR Data Management
1 -
html5
8 -
HTML5 Application
1 -
Identity cards validation
1 -
idm
1 -
Implementation
1 -
input parameter
1 -
instant payments
1 -
Integration
3 -
Integration Advisor
1 -
Integration Architecture
1 -
Integration Center
1 -
Integration Suite
1 -
intelligent enterprise
1 -
iot
1 -
Java
1 -
job
1 -
Job Information Changes
1 -
Job-Related Events
1 -
Job_Event_Information
1 -
joule
4 -
Journal Entries
1 -
Just Ask
1 -
Kerberos for ABAP
8 -
Kerberos for JAVA
8 -
KNN
1 -
Launch Wizard
1 -
learning content
2 -
Life at SAP
4 -
lightning
1 -
Linear Regression SAP HANA Cloud
1 -
local tax regulations
1 -
LP
1 -
Machine Learning
2 -
Marketing
1 -
Master Data
3 -
Master Data Management
14 -
Maxdb
2 -
MDG
1 -
MDGM
1 -
MDM
1 -
Message box.
1 -
Messages on RF Device
1 -
Microservices Architecture
1 -
Microsoft Universal Print
1 -
Middleware Solutions
1 -
Migration
5 -
ML Model Development
1 -
Modeling in SAP HANA Cloud
8 -
Monitoring
3 -
MTA
1 -
Multi-Record Scenarios
1 -
Multiple Event Triggers
1 -
Neo
1 -
New Event Creation
1 -
New Feature
1 -
Newcomer
1 -
NodeJS
2 -
ODATA
2 -
OData APIs
1 -
odatav2
1 -
ODATAV4
1 -
ODBC
1 -
ODBC Connection
1 -
Onpremise
1 -
open source
2 -
OpenAI API
1 -
Oracle
1 -
PaPM
1 -
PaPM Dynamic Data Copy through Writer function
1 -
PaPM Remote Call
1 -
PAS-C01
1 -
Pay Component Management
1 -
PGP
1 -
Pickle
1 -
PLANNING ARCHITECTURE
1 -
Popup in Sap analytical cloud
1 -
PostgrSQL
1 -
POSTMAN
1 -
Process Automation
2 -
Product Updates
4 -
PSM
1 -
Public Cloud
1 -
Python
4 -
Qlik
1 -
Qualtrics
1 -
RAP
3 -
RAP BO
2 -
Record Deletion
1 -
Recovery
1 -
recurring payments
1 -
redeply
1 -
Release
1 -
Remote Consumption Model
1 -
Replication Flows
1 -
research
1 -
Resilience
1 -
REST
1 -
REST API
1 -
Retagging Required
1 -
Risk
1 -
Rolling Kernel Switch
1 -
route
1 -
rules
1 -
S4 HANA
1 -
S4 HANA Cloud
1 -
S4 HANA On-Premise
1 -
S4HANA
3 -
S4HANA_OP_2023
2 -
SAC
10 -
SAC PLANNING
9 -
SAP
4 -
SAP ABAP
1 -
SAP Advanced Event Mesh
1 -
SAP AI Core
8 -
SAP AI Launchpad
8 -
SAP Analytic Cloud Compass
1 -
Sap Analytical Cloud
1 -
SAP Analytics Cloud
4 -
SAP Analytics Cloud for Consolidation
3 -
SAP Analytics Cloud Story
1 -
SAP analytics clouds
1 -
SAP BAS
1 -
SAP Basis
6 -
SAP BODS
1 -
SAP BODS certification.
1 -
SAP BTP
21 -
SAP BTP Build Work Zone
2 -
SAP BTP Cloud Foundry
6 -
SAP BTP Costing
1 -
SAP BTP CTMS
1 -
SAP BTP Innovation
1 -
SAP BTP Migration Tool
1 -
SAP BTP SDK IOS
1 -
SAP Build
11 -
SAP Build App
1 -
SAP Build apps
1 -
SAP Build CodeJam
1 -
SAP Build Process Automation
3 -
SAP Build work zone
10 -
SAP Business Objects Platform
1 -
SAP Business Technology
2 -
SAP Business Technology Platform (XP)
1 -
sap bw
1 -
SAP CAP
2 -
SAP CDC
1 -
SAP CDP
1 -
SAP CDS VIEW
1 -
SAP Certification
1 -
SAP Cloud ALM
4 -
SAP Cloud Application Programming Model
1 -
SAP Cloud Integration for Data Services
1 -
SAP cloud platform
8 -
SAP Companion
1 -
SAP CPI
3 -
SAP CPI (Cloud Platform Integration)
2 -
SAP CPI Discover tab
1 -
sap credential store
1 -
SAP Customer Data Cloud
1 -
SAP Customer Data Platform
1 -
SAP Data Intelligence
1 -
SAP Data Migration in Retail Industry
1 -
SAP Data Services
1 -
SAP DATABASE
1 -
SAP Dataspher to Non SAP BI tools
1 -
SAP Datasphere
10 -
SAP DRC
1 -
SAP EWM
1 -
SAP Fiori
2 -
SAP Fiori App Embedding
1 -
Sap Fiori Extension Project Using BAS
1 -
SAP GRC
1 -
SAP HANA
1 -
SAP HCM (Human Capital Management)
1 -
SAP HR Solutions
1 -
SAP IDM
1 -
SAP Integration Suite
9 -
SAP Integrations
4 -
SAP iRPA
2 -
SAP Learning Class
1 -
SAP Learning Hub
1 -
SAP Odata
2 -
SAP on Azure
1 -
SAP PartnerEdge
1 -
sap partners
1 -
SAP Password Reset
1 -
SAP PO Migration
1 -
SAP Prepackaged Content
1 -
SAP Process Automation
2 -
SAP Process Integration
2 -
SAP Process Orchestration
1 -
SAP S4HANA
2 -
SAP S4HANA Cloud
1 -
SAP S4HANA Cloud for Finance
1 -
SAP S4HANA Cloud private edition
1 -
SAP Sandbox
1 -
SAP STMS
1 -
SAP successfactors
3 -
SAP SuccessFactors HXM Core
1 -
SAP Time
1 -
SAP TM
2 -
SAP Trading Partner Management
1 -
SAP UI5
1 -
SAP Upgrade
1 -
SAP Utilities
1 -
SAP-GUI
8 -
SAP_COM_0276
1 -
SAPBTP
1 -
SAPCPI
1 -
SAPEWM
1 -
sapmentors
1 -
saponaws
2 -
SAPS4HANA
1 -
SAPUI5
4 -
schedule
1 -
Secure Login Client Setup
8 -
security
9 -
Selenium Testing
1 -
SEN
1 -
SEN Manager
1 -
service
1 -
SET_CELL_TYPE
1 -
SET_CELL_TYPE_COLUMN
1 -
SFTP scenario
2 -
Simplex
1 -
Single Sign On
8 -
Singlesource
1 -
SKLearn
1 -
soap
1 -
Software Development
1 -
SOLMAN
1 -
solman 7.2
2 -
Solution Manager
3 -
sp_dumpdb
1 -
sp_dumptrans
1 -
SQL
1 -
sql script
1 -
SSL
8 -
SSO
8 -
Substring function
1 -
SuccessFactors
1 -
SuccessFactors Platform
1 -
SuccessFactors Time Tracking
1 -
Sybase
1 -
system copy method
1 -
System owner
1 -
Table splitting
1 -
Tax Integration
1 -
Technical article
1 -
Technical articles
1 -
Technology Updates
14 -
Technology Updates
1 -
Technology_Updates
1 -
terraform
1 -
Threats
1 -
Time Collectors
1 -
Time Off
2 -
Time Sheet
1 -
Time Sheet SAP SuccessFactors Time Tracking
1 -
Tips and tricks
2 -
toggle button
1 -
Tools
1 -
Trainings & Certifications
1 -
Transport in SAP BODS
1 -
Transport Management
1 -
TypeScript
2 -
ui designer
1 -
unbind
1 -
Unified Customer Profile
1 -
UPB
1 -
Use of Parameters for Data Copy in PaPM
1 -
User Unlock
1 -
VA02
1 -
Validations
1 -
Vector Database
2 -
Vector Engine
1 -
Visual Studio Code
1 -
VSCode
1 -
Web SDK
1 -
work zone
1 -
workload
1 -
xsa
1 -
XSA Refresh
1
- « Previous
- Next »
Related Content
- How to use AI services to translate Picklists in SAP SuccessFactors - An example in Technology Blogs by SAP
- IoT - Ultimate Data Cyber Security - with Enterprise Blockchain and SAP BTP 🚀 in Technology Blogs by Members
- SAP HANA Cloud's Vector Engine vs. HANA on-premise in Technology Blogs by Members
- Introducing Blog Series of SAP Signavio Process Insights, discovery edition – An in-depth exploratio in Technology Blogs by SAP
- New Machine Learning features in SAP HANA Cloud in Technology Blogs by SAP
Top kudoed authors
| User | Count |
|---|---|
| 12 | |
| 12 | |
| 5 | |
| 5 | |
| 5 | |
| 4 | |
| 4 | |
| 3 | |
| 3 | |
| 3 |