Use Case:
Jack is an Analytics Specialist at ABC company. He frequently needs to create queries and reports using available CDS views. However, he didn’t find any suitable query to support his customer deal. So he decided to create a new query using the new Custom Analytical Queries app, which meets his requirements. He is trying to use the previously(
How to add master data attributes to a delivered data source by creating a customer CDS view) created custom view
YY1_PROFITCENTER.
Step1:

- Jack scrolls down and selects the business catalog “Query Design”. (1)
- Then he clicks the Custom Analytical Queries tile to start the Custom Analytic app. (2)
Step 2:

- In the Custom Analytical Queries app, Jack clicks the New button to create a new query for his use case.(1)
- In the “New Query” window Jack enters the following information: (2)
- Once he’s done, , Jack has to click OK to access the details of the newly created query “YY1_PROFITCENTERQ0001”. (3)
Step 3:

- On the query creation screen, Jack selects the “General” tab.
- On this tab, Jacks has to enter the label “Profit Center Query” (1) and go to the “Field Selection” tab. The other fields are filled automatically by the app.
Step 4:
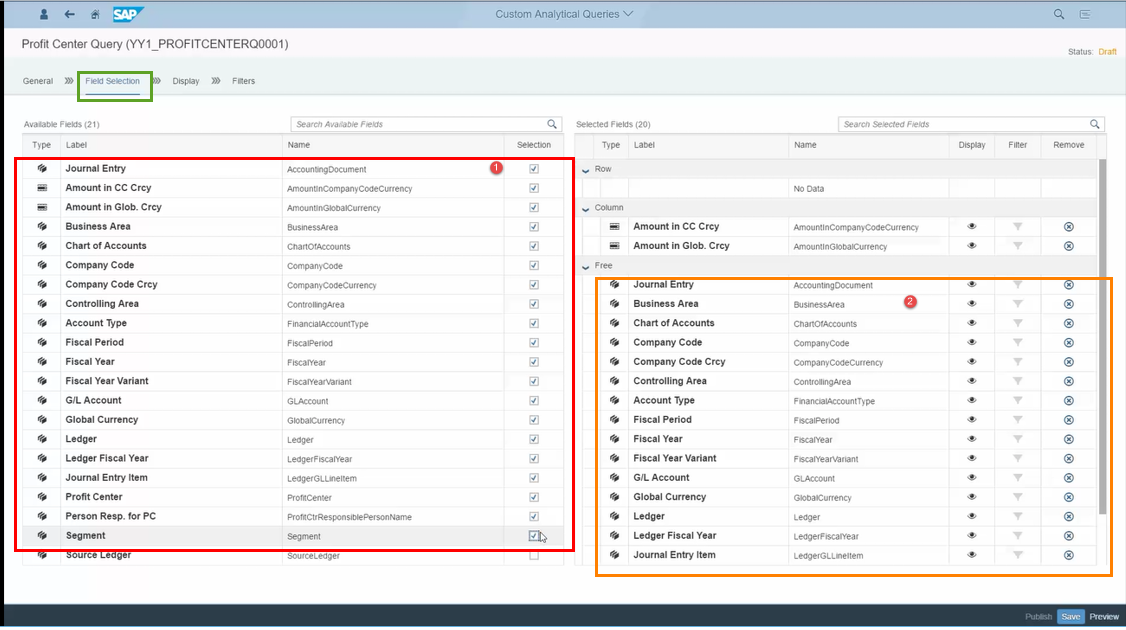
- Jack now goes to the the “Field Selection” tab.
- On the “Field Selection” tab,
- Jack checks the available fields that he can us.(1)
- Then he checks that the fields are automatically transferred to the “Selected Fields” table as well.(2)
Step 5:

- Jack moves to the “Display” tab because he wants to adjust some fields properties to meet his requirements. To do so, Jack clicks Display.
Step 6:

- On the “Display” tab , Jack selects several fields, to maintain their properties.
- One of these fields is Profit Center(1). Here Jack maintains its properties as follows:Jack checks the field “Display”(2) and sets Axis to “Row”.(3)
Step 7:

- After completing the maintenance of relevant fields on the tab “Display”, Jack clicks now on the tab “Filters” .
Step 8:

- On the “Filters” tab, Jack select those fields, for example, Ledger, needed for filtering(1)
- He maintains the field properties as follows:(2)
- He Select “User Input Values”.(3)
- Sets Selection Type to “Single”.(4)
- Selects Mandatory.(5)
Step 9:

- On the Filters tab:
- Jack marks those fields, for example, Company Code, needed for filtering.(1)
- He maintains the field properties as follows:
- Jack first checks the “User Input Values”.(2)
- Then he adjusts the following settings:
- Sets “Selection Type” to “Single” (4)
- Sets “Multiple Selection”(5)
- Sets “Mandatory” (6)
- Afterwards he clicks Save.(7)
- As Jack would love to preview the content of his newly created query, he clicks “Preview”.(8)
Step 10:
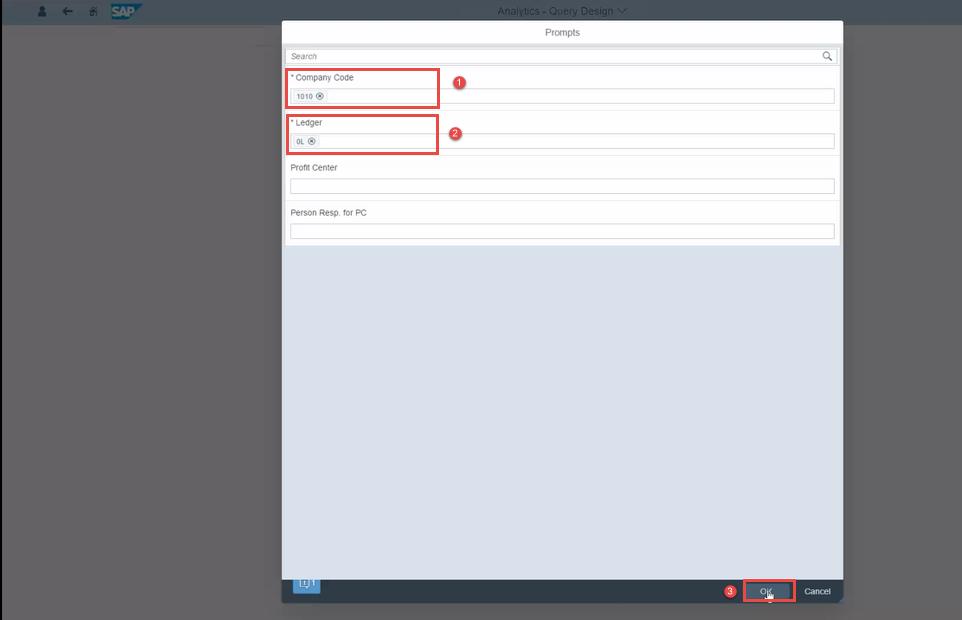
- To allow Jack to preview only content he would like to view, the “Prompts” window is displayed so that he can maintain the selection parameter as follows:
- Company Code with “1010” (1)
- Ledger with “0L” (2)
- Once he’s done with the selection parameters, Jack clicks OK(3) to preview the content.
Step 11:

- Jack’s content preview is shown but with “# # #” characters. These characters indicate that there are existing postings without Profit Center assignment.
Step 12:

- To remove these characters, Jack has to:
- Mark the “Person Resp. for PC”(1) , right click “Person Resp. for PC”(2) , then right click “Filter” (3) , and finally click “Filter Member”.(4)
Step 13:

- This is how Jack’s report looks like after removal of the “# # # #” characters.
Step 14:
 Step 15:

Another feature that could be helpful for Jack is the creation of a filter bar for selection. To do this, he has to:
- Click “Filters”(1)
The ‘’Filters’’ window is displayed.
- Here, Jack selects the field labeled with “Ledger”(2)
- After the selection of the field labeled with Ledger, Jack has to check the box right to it as shown on the picture (3). Checking this box leads to have the field “Ledger” shown on the filter bar .(4)
- To save the setting as variant, Jack has to click on the save button, enter a name for the variant name (Standard in our case)(5) and press the Go button(6)
- Jack now has the flexibility to display or hide the filter bar by clicking on the “Hide Filter Bar”(7)
- For the next steps, Jack decides to hide the filter bar
Step 16:

- The details selected by Jack are now displayed. For better analysis, Jack would like to reorder the information.
- For example, Jack would like to have the GLAccount as a row. To do so, he must add the dimension GLAccount(1) to “Rows”(2) by drag and drop.
Step 17:
 Step 18:

- In the “Save Tile” window Jack has to maintain the fields as follows:
- Title with “Profit Center Report”(1)
- Subtitle with “Filter by Responsible”(2)
- Group with “My Home” (3)
- Once he’s done, Jack has to click OK(4) to save his entries.
- And afterwards he must click on the icon “Home”(5) to trigger the persistency of the created App.
Step 19:

- A tile labeled with “Profit Center Report (Filter by Responsible)” as maintained above is now in Jack’s Business Catalog “My Home” (1) visible(2) and executable.
