
- SAP Community
- Groups
- Interest Groups
- Welcome Corner
- Blog Posts
- (Unofficial) Analysis Of The Answers.sap.com Quest...
Welcome Corner Blog Posts
Go a little bit deeper into the Welcome Corner with blog posts. Learn how to get started in SAP Community and get tips on maximizing your participation.
Turn on suggestions
Auto-suggest helps you quickly narrow down your search results by suggesting possible matches as you type.
Showing results for
Robert_Russell
Contributor
Options
- Subscribe to RSS Feed
- Mark as New
- Mark as Read
- Bookmark
- Subscribe
- Printer Friendly Page
- Report Inappropriate Content
05-19-2017
6:26 PM
Goto Update 29th May -Analysing Answers
Goto Update 10th June -Questions & Answers From New Users To The SAP Community
Background
Using the SAP Cloud Platform (SAPCP) I have been collecting data about the SAP Community and this blog will cover some of the analysis of this data. Previously I had covered a way to collect data via RSS feeds from blogs.sap.com but due to limitations of the RSS feeds the actual data was not consistent for further analysis. Using the SAP Search API (this API is also the backend engine that drives the OneDX search page and when you search this site) I have collected data from Answers.sap.com from 10th October 2016 to 30th April 2017. I am happy with the quality of data however first some background about the data set I will use. The base level technical details of how I collected the data can be found here in my SAP Cloud Platform blog, https://blogs.sap.com/?p=483124
Data Quality
I have collected questions since the beginning (10th Oct 2016) of the new SAP community via the SAPCP and SAP Search API and extracted such items as primary tags used in the questions. This does lead to lets say user classification issues, i.e do you pick the right tag when asking a question? I am sure that you do. Although I am also sure a moderators job on this site must cover a process to retag questions on a daily basis! And as you are reading this site I will assume you have familiarity with the concepts such as tags and how this site works (or do we know 🙂 how it works)
I collected the data on a bank holiday Monday at the start of May here in the UK. It was a one time loop over the dates (Oct2016 - Apr 2017) and therefore it is now out of date. There is also obvious potential for some questions to have been updated/retagged/deleted etc. I do not work for SAP and there are certain aspects of the answer.sap.com site that I can't collect or have access to. For example, I have the questions and the text of any answers but I do not know if answers are being accepted to these questions.
All charts were created with Lumira and I use out of the box features where appropriate. Lumira is accessing my data set in the SAP Cloud Platform. I have googled some ideas on how to present this data but data analysis is not my day job. My main primary goal was to use SAP technology and a challenge to see if I can present/analyse the data in an interesting way, let me know if I succeed or not with that objective! I'll cover some of my conclusions at the end of the analysis. If you are interested in seeing the raw data I have collected then let me know and I'll work out a way of sending it on to you. ( Although as mentioned I do cover the technical details in my other blog )
So with those details in mind and that again 🙂 the data is an unofficial snapshot in time of the status of this site. I'll get to my point and .... continue.
Total Questions and Authors in the Data Set 10th Oct 2016 - 30th April 2017

In total I collected over 41k questions and 23k Authors. The Author data is based on the unique AUTHOR_ID which links to the individual profile page. If you are anything like me then you may have multiple SAP IDs which may or may not be registered with the SAP Community. I chose to count Author_IDs only so there is potential for multiple Author_IDS linked to one individual or multiple Authors depending on shared use of one logon ID :). Does that make sense! And if not let me set an example and say hello to...
The Arun Kumars

Arun Kumar is the most popular Author name in the dataset and linked to multiple Author_IDs. I have used the Author_ID as the measure in all other charts (where appropriate). In some cases that could be the same person or not. However I will be using Author in the title of the chart but linked to Author_ID, it did sound a better option at the time of analysis.
Moving onto primary tags which are part of my data set.
Top Primary Tags For Questions

ABAP Development is the top primary tag for questions
Talking of tags, I had the idea to focus on the "Using SAP.com" primary tag that would cover questions about this site since its launch. If you have an issue using this site then you can search for similar problems. If you can't find an answer you can ask a question over here Using SAP.com Questions
I was curious to find out how many questions there would be for this tag and see if I could highlight any trends. This is what I found....
"Using SAP.com" Primary Tag Stats
A quick view of the overall totals

Overview of the timeline Oct 2016 - Apr 2017

Now the trend for questions is going down from the wild west days at the start!. What had just happened to this site on October 10th 🙂 Maybe some retagging or moving of questions had taken place as well.
I had some thoughts about this,
a) It is a good sign that there are no major peaks after the initial start of the new community.
although
b) Are questions being answered and is there an accepted answers to the question? Unfortunately as mentioned I do not know that detail from my data set. There is no data that I can find that indicates questions are closed with an acceptable resolution (or even just closed/deleted due to any other reason).
However closing/accepting answers to questions is an issue that generated a quite a bit of talk at the coffee corner of this site.
Link to the coffee corner. https://answers.sap.com/content/kbentry/list.html
Link to the conversation about accepting answers to questions
http://answers.sap.com/articles/35921/wondering-about-the-best-way-to-encourage-people-t.html
3b25c79e4ade4481aeb1b5125041254c started that particular conversation and at the time of analysis it was going for 136 days. The discussion was created on Oct 18th 2016 and 3rd March 2017 was the last update.
and finally
c) Are people still using the site? This was another thought from various statements I have read around here and else where. I knew I had the overall data of AUTHOR_IDS (with the risk of duplicates pointing to the same user as mentioned for that metric), here is the author data by a timeline. The chart below covers all tags (and not limited to Using SAP.com tag)

The data set I have indicates a stable view of the site use. No major rise or fall in author_ids. A slide to the new year and then maybe a very slight increase via the running average line in the chart. I took the 3 day default for running average in Lumira.
A look at the overall questions by date and it indicates a very similar picture.

StackOverFlowed
One option for user migration may be the availability of another forum to ask questions. I was interested in one of the top primary tags SAPUI5 for authors over the time period.
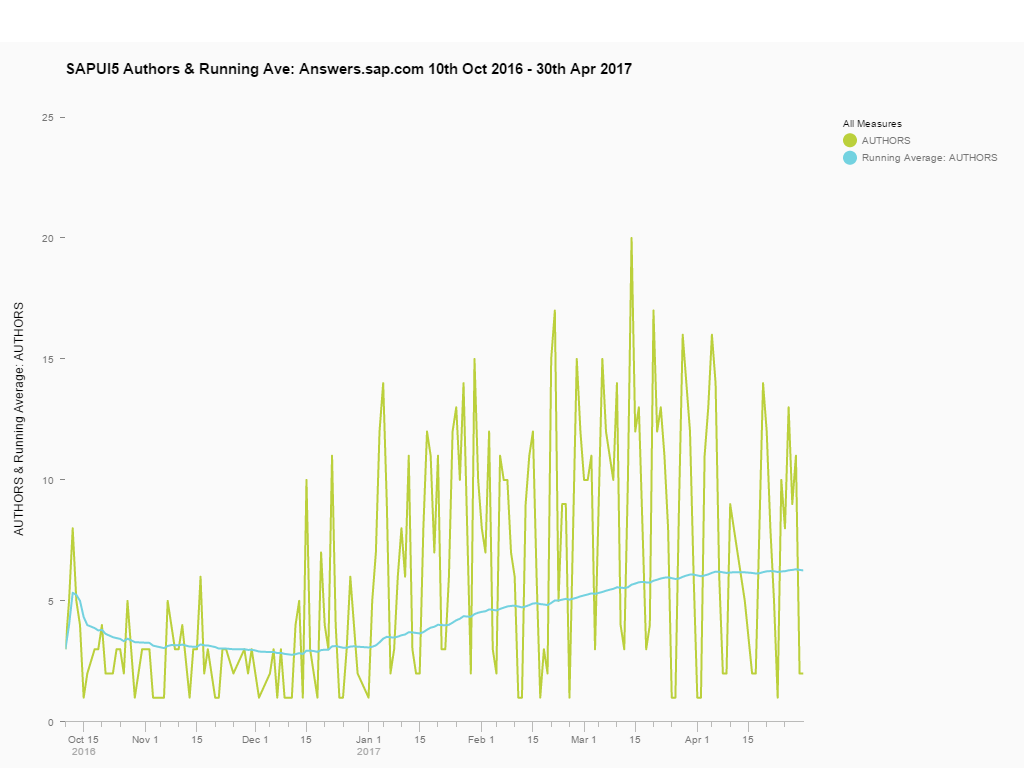
I did notice a steady increase since the start of the year (maybe new year resolutions to learn UI5 ;)) so a good sign that more people are using the SAPUI5 tag but I make no comments about the quality of these questions. If you have direct involvement in UI5 primary tag I would be interested in your thoughts on the activity the above chart indicates and availability of other forums.
Back to Using SAP.com Tag
As in a similar process to the longest lasting discussion on coffee corner, what question generated the most characters on this tag. (say what does that mean 🙂 ?) Well I used a simple character count to find the top question on Using SAP.com.

Link to the top question in the screenshot.
http://answers.sap.com/questions/45130/has-the-new-sap-community-killed-the-community.html
The question was "Has The New SAP Community Killed The Community?", well I am not sure in every aspect but I am still using the SAP Community and I will continue to use the site.
However that triggered a thought to use HANA's Sentiment Analysis on the Using SAP.com forum. I have not used Sentiment Analysis before so first thing was to check out an OpenSAP course
Overall table of sentiment for "Using SAP.com" tag is below. A link to Open SAP course on the subject of "Sentiment Analysis"

I have been checking the analysis and my dataset is based on a question/answer forum and the SAP analysis is "Voice of a customer" I am not sure if the use case is an exact match. As I said a the start, I googled 🙂 and some statements about "sentiment on forums works differently" and that is only one link but I found some other statements matching that one. Also another that compared many different sentiment algorithms for forums sites as well. However I don't believe everything I read on the internet but it did make me question the value of the sentiment analysis on my dataset. However I will use the process to highlight the positive and then the negative, as this leads me to make some points later on!
Top Positive Words

*a good sign that manners and thank you are common on the site 🙂
Top Negative Words

I will pick out one negative word, and my word is frustration. The most frustrating thing for me on this site is this....

Frustrating and annoying especially browsing the answer forum on a mobile. I click accidentally and regularly! And never find my way back to where I started after I click on the "Show More" icon. I wish it goes away. I would prefer something like the screenshot below for navigation and seeing more content. It is used in the search pages of SAP Search API (OneDX). I know I will return to an expected place using the search pages.

I have up voted an idea on Ideas.sap.com for the SAP Community about navigation https://ideas.sap.com/D42410 also this one,
https://ideas.sap.com/D40252. I know from reading the comment that this idea as a whole about using Fiori will not be accepted. I voted to show I do not like the current navigation. Hopefully "+ show more" will be no more soon.
Back to my own data set and something in the text of questions that triggered my interest.
I decided to use only SQL commands and a base text analysis approach over the entire 41k questions. It seemed sentiment on so many different subjects/tags would not be of value but as I say I only have beginners knowledge of text analysis. So what could I find out about 41k worth of questions/answers with SQL and core text analysis. By core text analysis I used the "EXTRACTION_CORE" option which ".. extracts entities of interest from unstructured text, such as people, organizations, or places mentioned" source The people part of that option sounded like a possible way to see who was answering questions. However I begin with...
The Hour Of The Guru
I thought I would see how many questions open with a "Hi Gurus," in the data set. That seems a popular opening line to any question. I used a straightforward SQL statement to try and find out how popular it was. It seemed a better fit to look for the phrase " Gurus," as there are variations to the theme of guru, such as "Hi Gurus," and "Hi SAP Gurus,".
Original SQL Analysis
Top 5 Primary Tags saying Hi to the Gurus,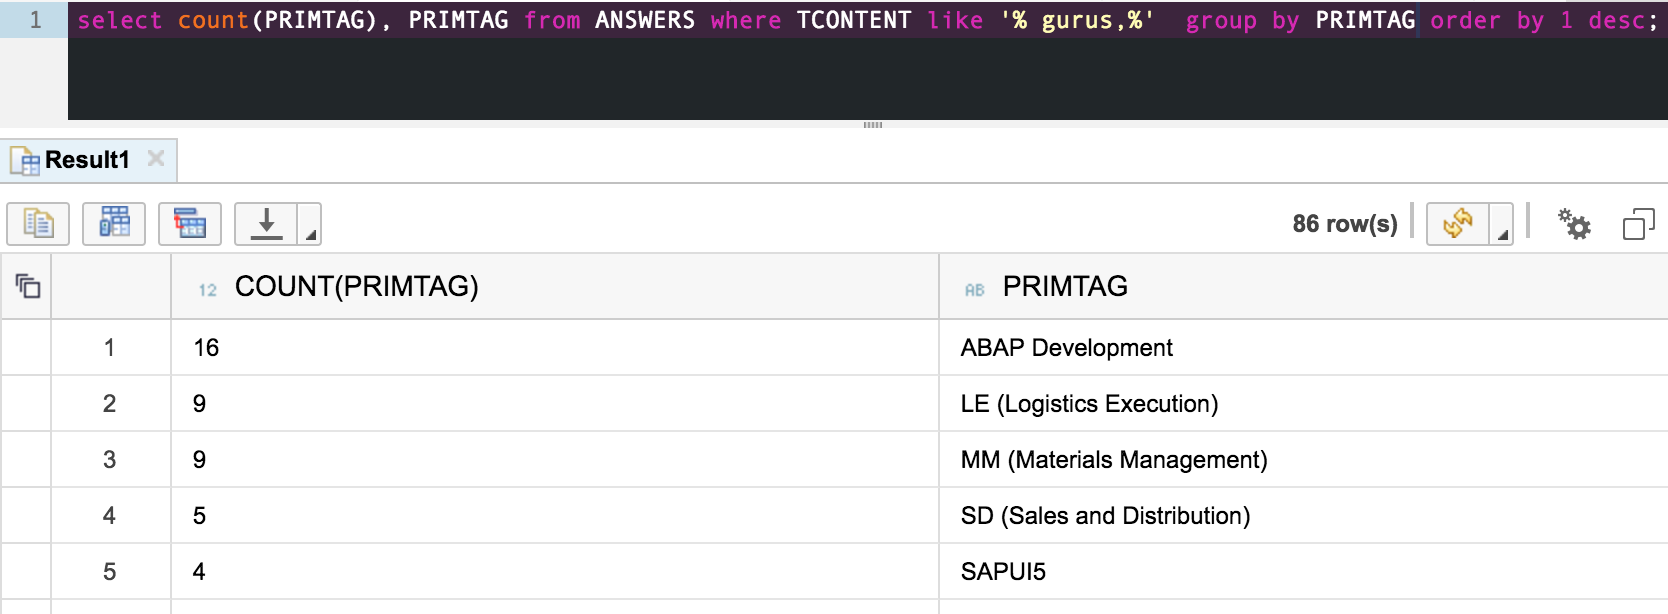
Not as many as I initially expected but probably an issue in how I am looking for the Gurus in the data.
If you are using Internet Explorer then the above Original SQL Analysis will be visible any other browser you can click the arrow to see the original query looking for Gurus.
I had a "light bulb" or maybe a "Doh! that was obvious thing to try" moment prompted by Jürgen's comment below.
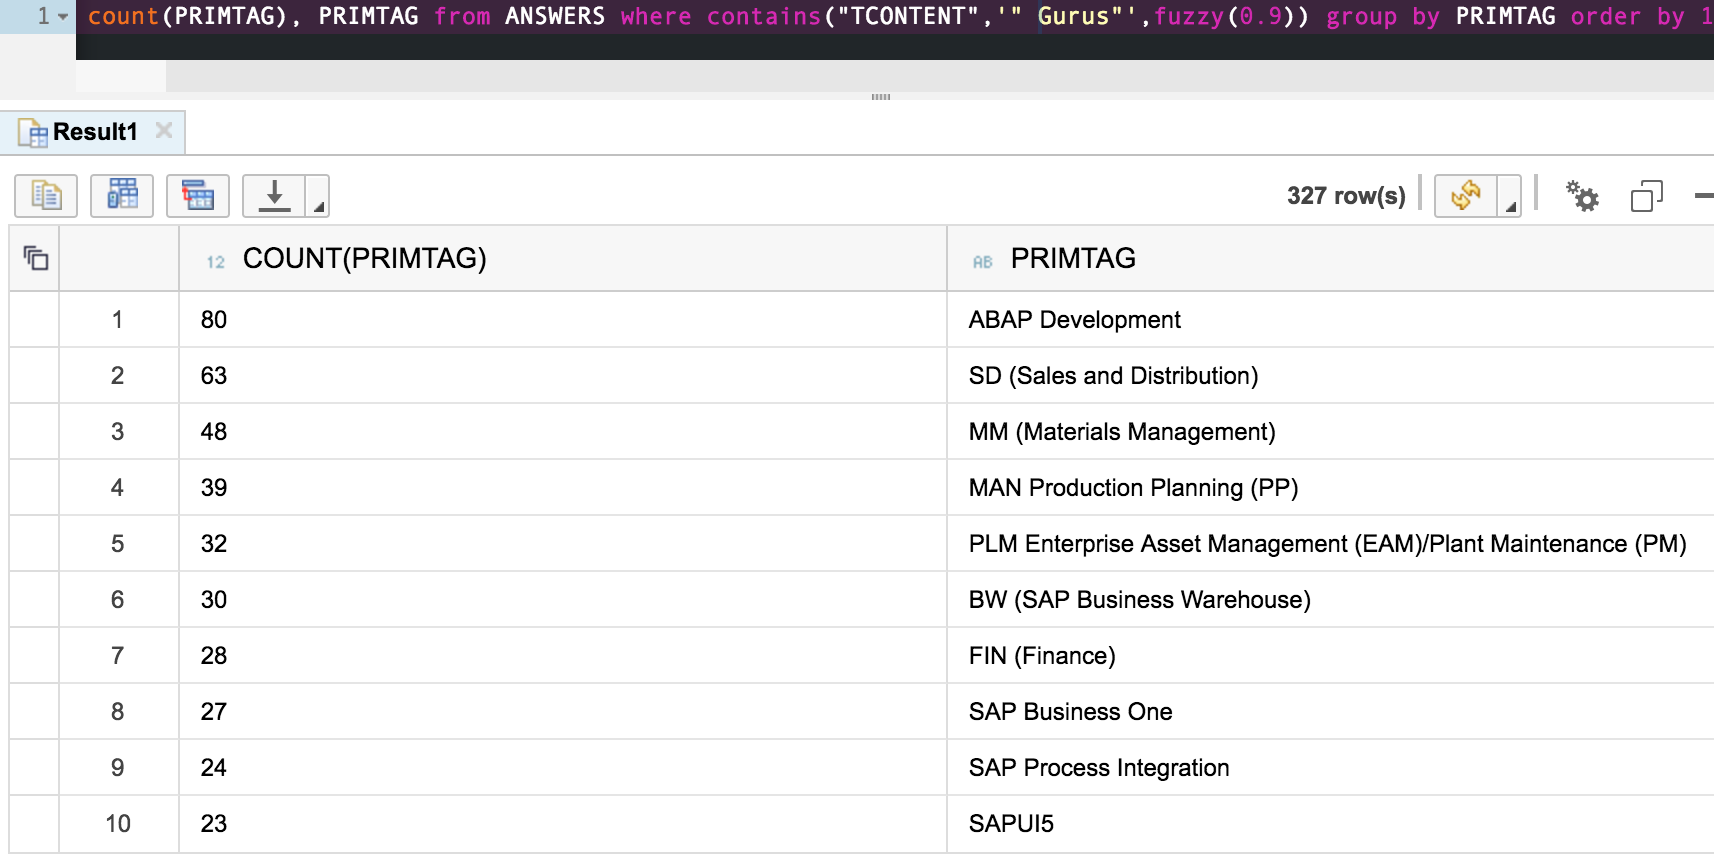
I realised I should use the in built HANA search engine with whats known as a Fuzzy index with my SQL query. It now seems a pretty obvious thing to have tried with HANA from the start. As the SAP Search API was the source of my data but I ignored that for the analysis! Well something for me to learn about and try right now. As that was my intention anyway to learn new things about SAP alongside this data analysis.
So the query I came up with is below for Guru's
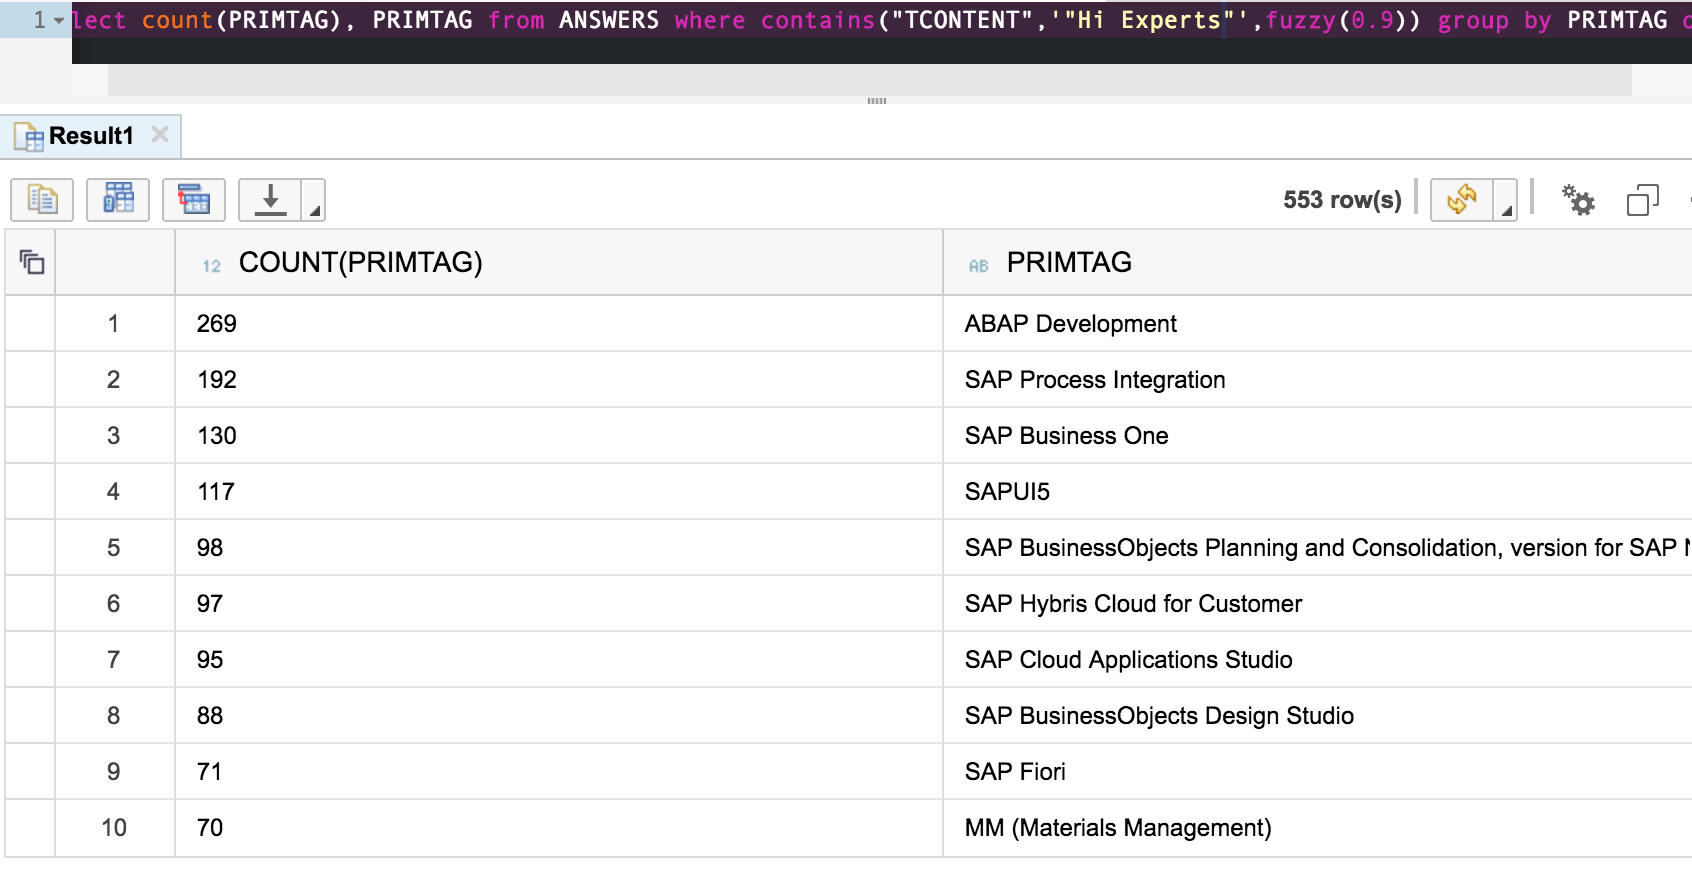
From Jürgens comment a query for "Hi Experts" on Primary Tags
I moved on to identify the day and hour when most questions are asked on Answer.sap.com site.
As with my Data Geek entry trying to find the best date and time to blog on SCN. From that analysis (link below) I found it best to publish a blog on Wednesday at 13:00
https://blogs.sap.com/2013/08/14/data-geek-challenge-analysing-the-scnblogs-twitter-timeline/
So what day and hour do we need the gurus most?
Top day for questions

Drilling down into the top day Wednesday
Hour with the most questions
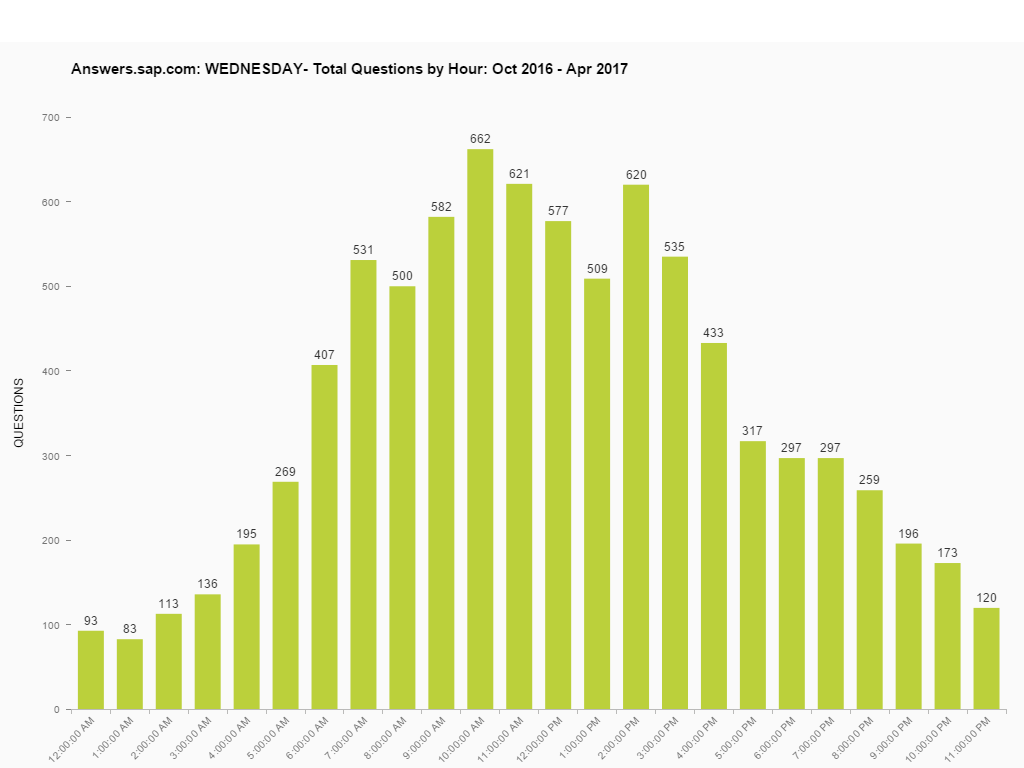 https://blogs.sap.com/wp-content/uploads/2017/05/WednesdayByHour.png
So calling all gurus 😉 , we need you standing by your keyboards most on Wednesdays at 10am.
Err, when is 10am for you? probably not the same 10am as me. I.e. SAP Community is a worldwide site covering many timezones. We need to co-ordinate the gurus coming together at the right time 🙂
So my dataset is GMT/UTC so work out what 10am is in your timezone gurus and boot up the laptop and logon and be ready to answer some questions :).
Core Text Analysis
The final text analysis as a reminder is based on "EXTRACTION_CORE" option which ".. extracts entities of interest from unstructured text, such as people, organizations, or places mentioned" source
I was hoping to identify actual people who answer questions by full name. As it turns out I failed to do this as the analysis picked out mostly only first names and SAP product names. As shown below. However some of the names in the list I am sure I do know the individual full name that has created most of the entries. I am impressed by the contributions they make to this site. The SAP Community site wouldn't be the same without them and actually I didn't need any analysis to know how much they do contribute ;). I left the SAP product names in place and I am sure you know some of the real full names below as well. This is what the HANA text analysis identified. Who is this BADI in amongst us though 🙂

Isn't it Ironic
During the process of putting this blog together it actually triggered my first question on Answers.sap.com. I used Lumira to analyse the data in my trial SAPCP via opening a database tunnel - technical info here. This does not work consistently at the moment and also I can't connect via Eclipse to my trial account. It has delayed me completing this blog.
For my question, I have actually changed the way I comment on this site and that is due to this data analysis. That change is thanks to Diego Lother and the way he contributes to the site (not sure if mentioning people works on this site but I will try this diego.lother ). Diego's full name(well at least first name and surname ) appeared in my text analysis process and that is different to others. I was curious to see why and to my knowledge (I have not gone through all of his content) Diego uses his full name every time he answers a question or contributes to the site. It seems kind of obvious to me now as others use first name and sometimes no name at all. I was initially hoping for AUTHOR_ID to uniquely identify users but alas that was not the case. However I will try and use Diego's method myself and use my surname on content/comments, well apart from any future contributions to coffee corner! Not that I propose I will try this analysis in the future but it seems a good method to use when commenting on this site. I am curious though if Diego manually types his name every time or uses some sort of short cut key signature method? If you do read this blog Diego then can you answer that for me? Or maybe I should ask a very specific question to Diego on the Using SAP.com answer/question forum 😛

Validation Of Data And Missing/Deleted Questions
As mentioned in the Data Quality section at the top I was conscious to validate the data set and ensure at least what I had was valid. As I do not work for SAP I relied on the search API and the actual SAP Community site to cross check my data. It is a snapshot from the 1st May 2017 and during the process of writing the blog (and delay due to Lumira/SAPCP access issues!) I ran some random checks on the data. What I did notice was missing/deleted questions is common, so I took some time to ensure a random sample was at least accurate and valid for a snapshot collection.
E.g. Maybe a bit technical so bear with me, I took 1000 URLs and ran that through a unix command to check for the the HTTP return codes. Out of the 1000 then 20 questions 2% had gone missing. I still had valid data though in a snapshot sense. For example this URL is no longer found on this site.
https://answers.sap.com/questions/103814/enhancement-section-not-changeable-or-replaceable.html
However it exists in google cache so I am happy the data set is valid as much as I can prove it to be valid 🙂
https://webcache.googleusercontent.com/search?q=cache:ff6DqOPQ5NEJ:https://answers.sap.com/questions...
The 2% out of my sample seemed high though for deleted/removed questions. Although I do not know what if any the average for deleted questions should be on a forum site.
Conclusion
The phrase "Steady as she goes" seemed appropriate initially from the stats. However I would clarify, I see that in a free from fluctuation sense and not stability of the site. That is linked to the running average of questions/authors and overall statistics remaining flat. Also I was slightly disappointed missing a key metric of analysing answers to questions. While my intention is always to use SAP technology and not necessarily linked to SAP Community site, I do enjoy the process of collecting/analysing data. I will keep the data set for a while longer to see if I can improve my text analysis skills :0 or any other related SAP tech as well.
I have found and continue to find some of the site functionality frustrating as well. I have a lot of time for the SAP Community and taken out more than I will put back in, so I will be around for as long as I work in the SAP field.
Thanks for reading and I am left with one thing to do and that is to sign off 😉
Best Regards
Robert Russell
.
Update 29th May 2017
Analysing Answers
⇑
Answers To Questions
Following on from the blog above, I was having a discussion with db8ac33b71d34a778adf273b064c4883 about being unable to collect the details of answers to the questions here on the SAP Community. He pointed out there was a way to get these answers (and questions ;)) on this site so I was intrigued and checked out the details he provided. I had already set up my SAP Cloud Platform trial account to retrieve information from the SAP Search API to get th... for the original blog above. So I simply adjusted the collection code to point it at this new source of information and adapted my HANA calculation view to include the data in my Lumira analysis below. I chose to only focus on the answers as I had already collected the questions as detailed above. So I kept the same data set of questions from 10th Oct 2016 to 30th April 2017 and now added the answers to these questions. I do comment on data quality at the end of the blog this time, but to point out the data is from publicly available sources only and not from SAP.
First an Overview of Answers and Questions

In my original data set I had found that over 23k authors had created over 41k questions. Starting from the 41k questions as my master dataset, I analysed the answers linked to these questions and found that over 11k authors had provided over 53k answers. I am sure you realise there are questions with multiple answers and some with no answers at all.
I’ll use a similar breakdown of Questions by Primary tag as before but also include the total answers this time.

The chart is the top 10 questions by primary tag (in green) next to the total answers. I did notice that the “SAP Hybris Cloud for Customer” tag had less answers in proportion to questions than the other tags in the chart.
No Answers At All
Some questions do not get any answers at all on this site. The chart below shows the number of questions per tag with no answers.

In the previous chart primary tag “ABAP Development” had 2394 questions with 3675 answers. However, as the above chart shows, 680 ABAP Development questions had no answer at all.
Also the primary tag “Using SAP.com” features in the top 10 of questions asked but does not feature in the chart above in regards to questions without answers. It seems people are prepared to answer questions about “Using SAP.com”. That tag brings me onto the following topic.
Accepting Answers
As per my original blog above a question was asked on the Using SAP.com tag “Wondering about the best way to encourage people to "accept" answers to their questions...?” . I found I had the details to answers that were marked as accepted.

The chart above shows out of the 53k answers only 7652 have been accepted. As I type this blog, I realise that the chart above might be a bit misleading as it not possible for all 53k+ answers to be accepted. It may have been better to have shown the accepted answers next to the 41k+ questions (as only one answer can be accepted per question - as per my understanding of the site).
A breakdown of primary tags with accepted answers below.

From the data I also had the Author_ID as mentioned at the very beginning of this blog. So I can break down the accepted answers by author_id as follows.

jrgen.lins has the most accepted answers closely followed by vadim.kalinin
Up And Down Voting
Another feature of this site (and also part of the data set I have on answers) is the ability to up or down vote answers. (the same applies to the actual questions but I only have the data for the answers). The following icon appears next to each answer.

The top authors with most votes purely on the answers in my data set are (**does not include question votes).
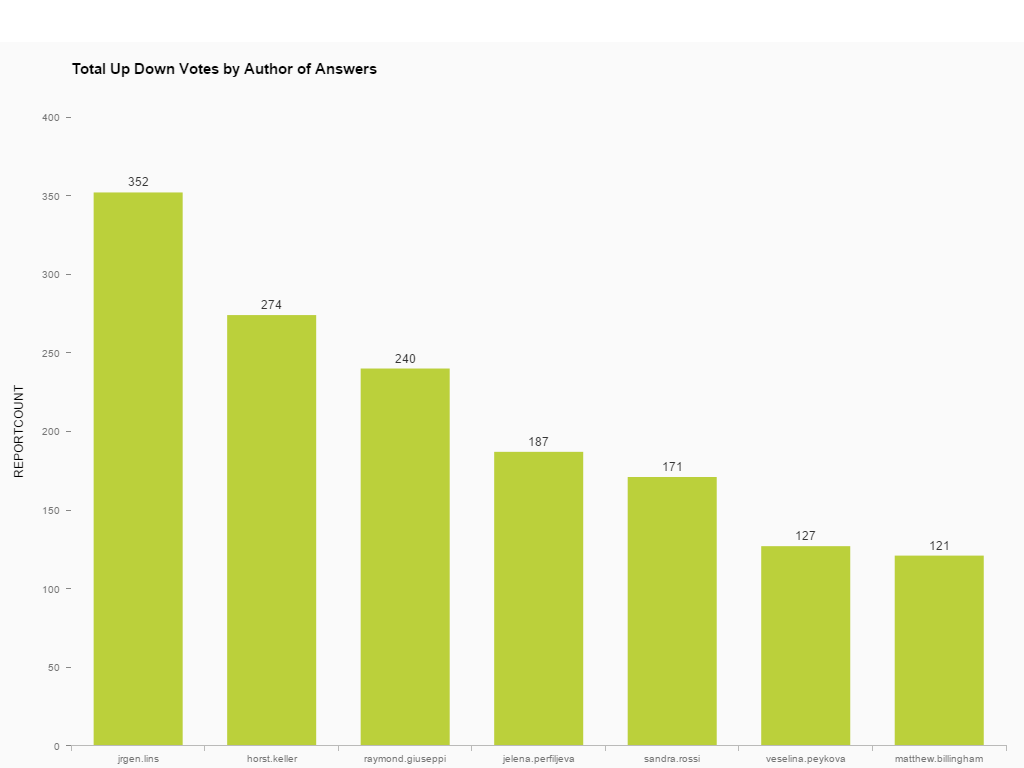
jrgen.lins again top of the charts
I thought I would try and identify the top questions overall with the most votes. The top voted questions predominantly appear in one tag and it is the “Using SAP.com” tag

I have mentioned the top voted question earlier (**only includes the votes on the answers as mentioned).
The question was “Has The New SAP Community Killed The Community?” this particular question would have had a higher overall total if not for one particular down-voted answer which brings the overall total down.
Following on from the overall totals for questions I checked out which individual answer had the most votes and it is,

Thomas Fiedler with this answer (or T-Shirt slogan 😉 to this question.

I agree “ABAP is not dead” judging by the activity in the question and answer forums 🙂 but I would state it is (/they are ;)) getting older. Reminds me of a map of old ABAP developers.
https://blogs.sap.com/2014/02/07/choropleth-maps-of-scnblogs-links-and-crime-data-using-sql-anywhere...
And Finally Some “Reputation” Calculation (Karma)
In the publicly available data source I used to get the answers then there is a “reputation” value and I am linking it to karma credits. The 57 “reputation” value in my answers matches my current karma level of 57. If you are do appear on the chart then the values are a snapshot of the data collection from 28th May. The “reputation” value is publicly available and not locked behind any authentication mechanism so is part of my data set. In the Karma Q&A it does state that the karma is locked away to lessen competition. However the values are below and I am sure the people contributing to this site don’t take part in any karma competitions, but I was curious to see the values anyway.
Only author_ids that have answered a question on the answers.sap.com site (Oct16-Apr17) appear in the chart below, it should not be considered an official list of karma credits overall for the SAP community. I am pretty sure it is karma credits value but maybe you can tell me I have a case of bad karma 😉 and wrong about these figures.
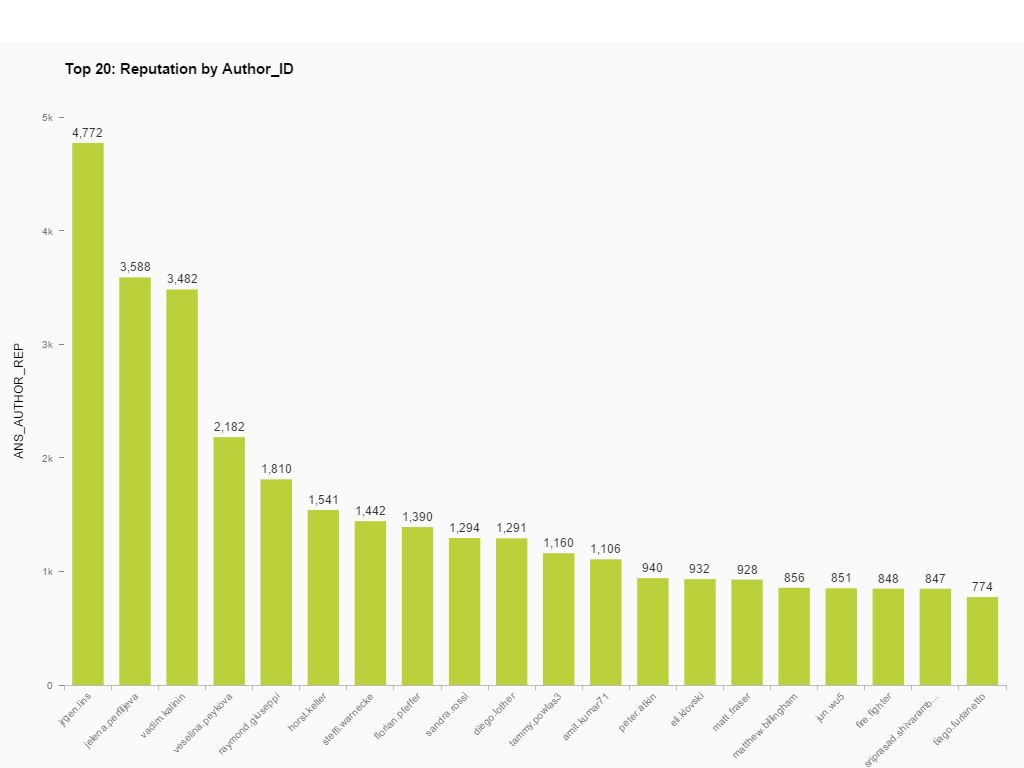
It is impressive Jürgen the way you lead the community.
Data Quality.
Again as per the opening statements to this blog I have double checked the figures and I am happy that it adds up ;). However, the data is not officially provided by SAP and there may be some mistakes that I haven’t found yet. Although all the checks that I have made so far have proved to be valid and correct. I do read publicly available data sources to read the data into the SAP Cloud Platform and all charts are again produced in Lumira reading a HANA calculation view. I enjoy the challenge and process of HANA modelling and have taken time to ensure the data is correct. Let me know if you spot anything obvious in the data you need clarification on. A screenshot of my latest calculation view in HANA on the SAP Cloud Platform that I used to enable this analysis is below.
I’ll end with a thank you to Bartosz for passing on his information and thank you for reading the blog.
And a finally sign out,
Best Regards
Robert Russell

Questions & Answers From New Users To The SAP Community
⇑
For my last and final update to this blog 🙂 I thought I would check out new users who have joined the community since its update last year. Using the SAP Search API as before you can search “people” and using the filters limit the results to a time period. So I chose to extract new users from 10th October to the 30th April 2017 and check out how they were using the Answers.sap.com site. I thought I would be able to spot new trends or items of interest for these new users. You can read the rest of this update to check out what I found. However I will start with some statements about the data source ;). If you are familiar with the rest of the blog above then my data source is from publicly available sources and not officially from SAP (I will keep banging on about this and mention it at regular intervals - just make sure you understand that point 😛 )
The overall new user totals shown in the screenshot below.

For the period of 10th Oct 2016 - 3rd March 2017 a total of over 36k registered new users. The chart above is my Lumira analysis of my data set in the SAP Cloud platform and the SAP Search is in the red box as I used this as validation I had extracted the correct data.
For this SAP Community site however I would suggest it is almost impossible to know the total amount of users via this method of search. That is due to a lot of possible reasons e.g. multiple accounts belonging to one person and this possible reason I found last time I looked at users of SDN. I have multiple SAP IDs and some are linked to the SAP Community and also I am sure that some individual SAP IDs may be shared by more than one person. So my dataset is a collection of new user accounts and not necessarily 36k individuals. However for simplicity I will use the term “users” from now on. I chose to look at how these users registered over my chosen time period.

The above chart is the timeline when new users were created on the site. There is a running average and this does indicate a decline in new users being created on the SAP Community. There is a sudden drop in March and that leads me to….
A Problem With Search
While working with the people search functionality of this site I found it is broken since the 4th of March. (Or no new users since that date 😉 ) . The link below searches for people between 4th March - 10th June.
https://onedx.find.sap.com/s#t=people&n=1&p=default&repo=srh&f=TYPE%3Apeople%2BUPDATED_TIMESTAMP%3Ab...

The above just highlights the current problem with the search of people.
I chose to carry on and use my dataset as a selection of new users 🙂 and see how they use the site as obviously there maybe some issues with the search engine.
I had a look at my chosen time periods compared to previous years.
10th Oct 2014 - 3rd March 2015 = 51,653 new users
10th Oct 2015 - 3rd March 2016 = 48,570 new users
The rest of my analysis is based on the following dates and shows a decrease in newly created users showing a marked drop in user creation.
10th Oct 2016 - 3rd March 2017 = 36,483 new users
New Users Questions

The above chart shows 2,932 new user accounts (out of the total 36,483) asked questions.
These 2,932 users asked a total of 4,636 questions. It seems fine ratio of users asking questions out of the total but as mentioned there are issues with knowing the exact total user count for this site. There are rules of thumb mentioned here for content creation- https://en.wikipedia.org/wiki/1%25_rule_(Internet_culture)
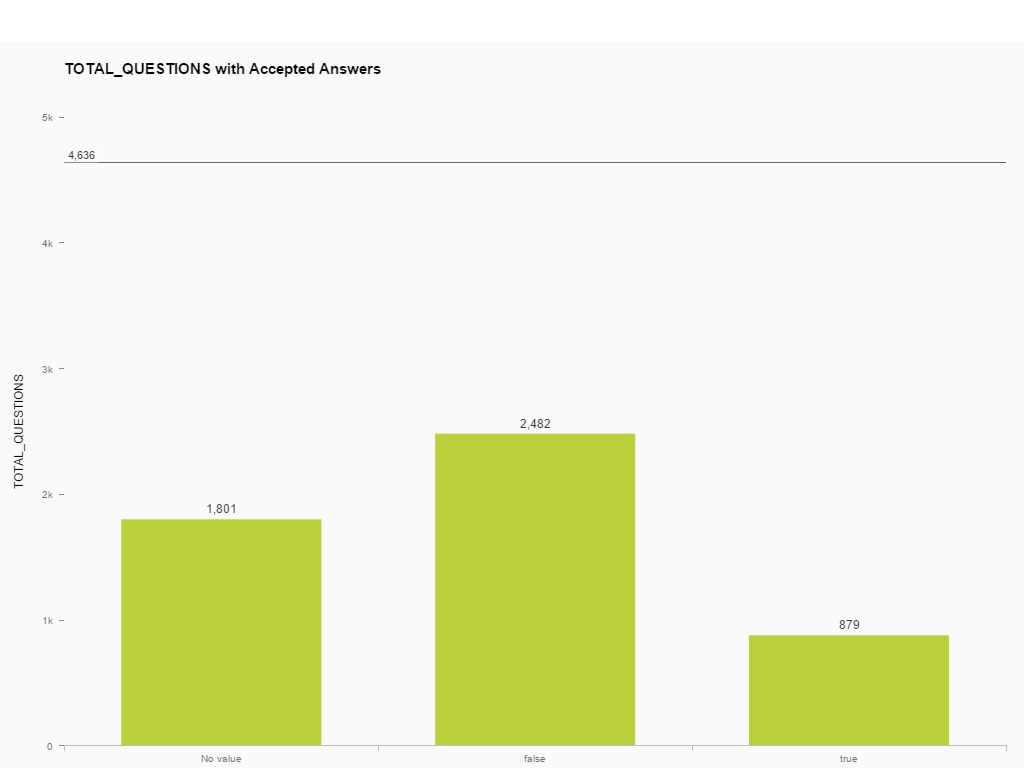
I covered an issue, that triggered a lot of debate on this site, earlier in this blog about users accepting answers to their questions. So I thought it would be interesting to see how the new user accounts are accepting answers to their questions. Below is a chart showing only new user questions. The marked “true” column is where a new user has accepted an answer to their question. The “no value” is where their question received no answers. The “false” column indicates there are answers to the questions but not accepted.
A valid comparison in my mind though is 879 accepted answers to the 4,636 total new user questions. (there can be more answers than questions as each question can have multiple answers). The ratio 879 accepted answers to 4,636 questions doesn’t seem too bad to me but room for improvement ;). Although I make no claims to the quality of the accepted answer 😉 e.g user accepting the wrong answer!
New User Questions by Primary Tags
My collection of data from this site used a method which identified questions by primary tags. I had a theory the primary tag would be of the highest value as either the question would appear in the correct primary tag or a moderator of this site would move the question to another (correct) tag 😉 . Michael, Jürgen and Jelena mentioned the issues with tags in the comments below. There is the possibility that the tags do not even have a helpful/relevant name at any given time or a wide dispersal of questions around the (many!) tags available on the site. However I have what I have 😉 and was expecting “ABAP Development” to be the dominate tag for the new users as “ABAP is not Dead” as mentioned earlier 🙂 .
A top 10 chart of primary tags with the highest total of new users below.
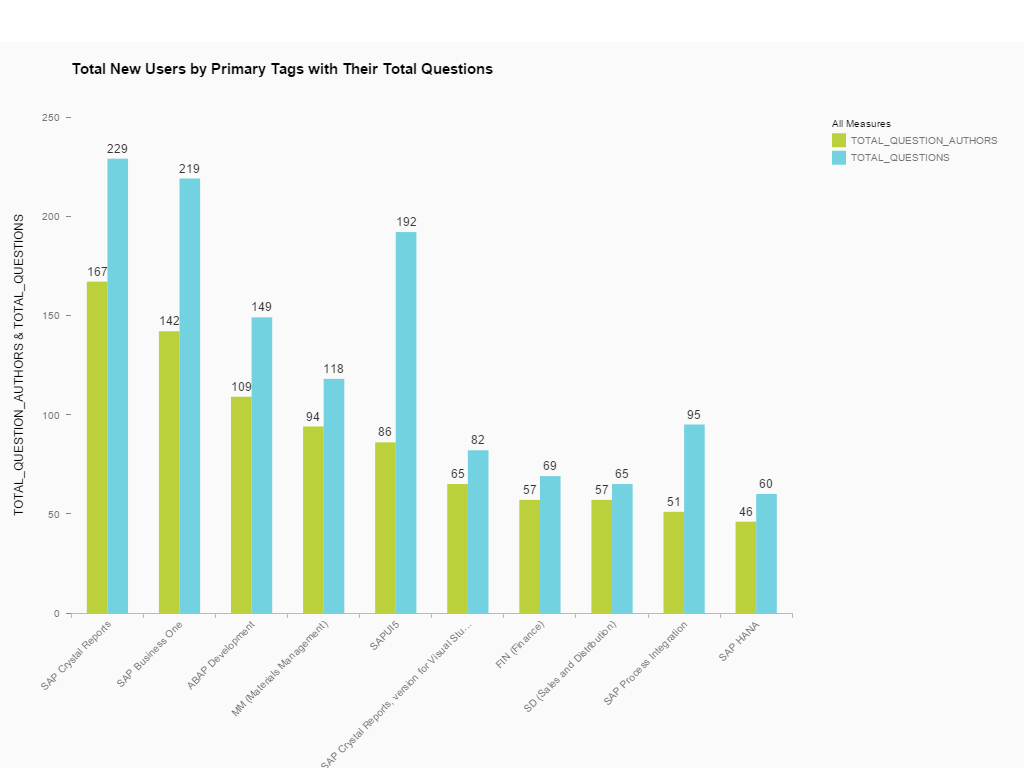
SAP Crystal Reports Tag was the top tag for the total number of new users asking questions and the total questions they asked. ABAP Development came in third in my sorting of the chart.
I thought I would drill into these primary tags to find out the accepted answer status for the new user questions.

I am going to highlight the tag “SAP Crystal Reports, version for Visual Studio” as the chart above shows some interesting status details. For this tag the accepted answer total is high and every question asked by these new users had an actual answer (in the time frame of my data set Oct 2016 - Apr 2017). Quite impressive and I clicked on this tag and hit the “+ show more” button and saw lots of answers to questions ( I can’t (refuse to) use that “+ show more” button too much because as soon as I follow a link I know I am going to hate the experience of getting back to where I was, as I mentioned previously)
Link to the SAP Crystal Reports, version for Visual Studio tag
https://answers.sap.com/tags/01200615320800001270
I was expecting some other primary tags to feature in the top ten and fully expected to see Fiori make an appearance. But highlighting the dispersal of questions around the many tags I specifically chose to filter all primary tags with "Fiori" in the title (in my data set) for new users below.

My main takeaway from my work with this new data is the decline in new members although again that is a hard figure to actually quantify. There are issues with SAP Search API for new users which may or may not be resolved from the 4th March. Also I had heard of Crystal Reports as an "in passing" kind of way as it is always featured on this site but I do now have respect for how these tags attract new users and the community provide answers to Crystal Report related questions.
Thanks for reading my blog (re-reading 🙂 and making it to the end 🙂 …
One final sign off…..
Best Regards
Robert Russell.
- SAP Managed Tags:
- SAP Community
17 Comments
You must be a registered user to add a comment. If you've already registered, sign in. Otherwise, register and sign in.
Labels in this area
Top kudoed authors
| User | Count |
|---|---|
| 5 | |
| 2 | |
| 1 | |
| 1 | |
| 1 | |
| 1 | |
| 1 | |
| 1 | |
| 1 | |
| 1 |