
- SAP Community
- Products and Technology
- Enterprise Resource Planning
- ERP Blogs by Members
- Embedded Analytics in S/4HANA (with demo videos)
Enterprise Resource Planning Blogs by Members
Gain new perspectives and knowledge about enterprise resource planning in blog posts from community members. Share your own comments and ERP insights today!
Turn on suggestions
Auto-suggest helps you quickly narrow down your search results by suggesting possible matches as you type.
Showing results for
ugur_58
Participant
Options
- Subscribe to RSS Feed
- Mark as New
- Mark as Read
- Bookmark
- Subscribe
- Printer Friendly Page
- Report Inappropriate Content
04-25-2017
10:22 AM
In previous blogs I have touched upon the embedded analytics functionalities in S/4HANA 1610. In fact in some specific topics I have shown you what you can achieve with HANA Live or tools like Analysis for Office. Specifically in the Attributed Profitability Segments blog I did show some reporting possibilities in S/4HANA. In this blog I aim to give a good overview of the purpose and added value of embedded analytics in S/4HANA. After the overview I will post demo videos per analytical tool at the end of this blog.
In most of the ERP implementations I see that the reporting requirements and workshops are done at the end of the project. It's like saving the best for last, but in reality business processes cannot be separated from analytics. At least when we talk about operational reporting. Other major issues I see are system design and configuration which at the end does not match the reporting requirements. The system is not designed and configured with the desired output (reports) in mind and you will only find this out during the analytics/reporting workshop which are planned at the end of the project.
With the rich analytics content which comes out of the box with S/4HANA this can be improved significantly when it comes to operational reporting. Reports and dashboard do make more sense for users when it’s visualized in a user friendly interface like Fiori. With embedded analytics in S/4HANA SAP makes a huge step forwards in the integration of the transactional and analytical world.
Consistent user experience across all analytical use cases
To explain this principles further. With consistent user experience we main to say that even applications with different use cases should work the same way for e.g. filtering, printing, data export, role based access etc.
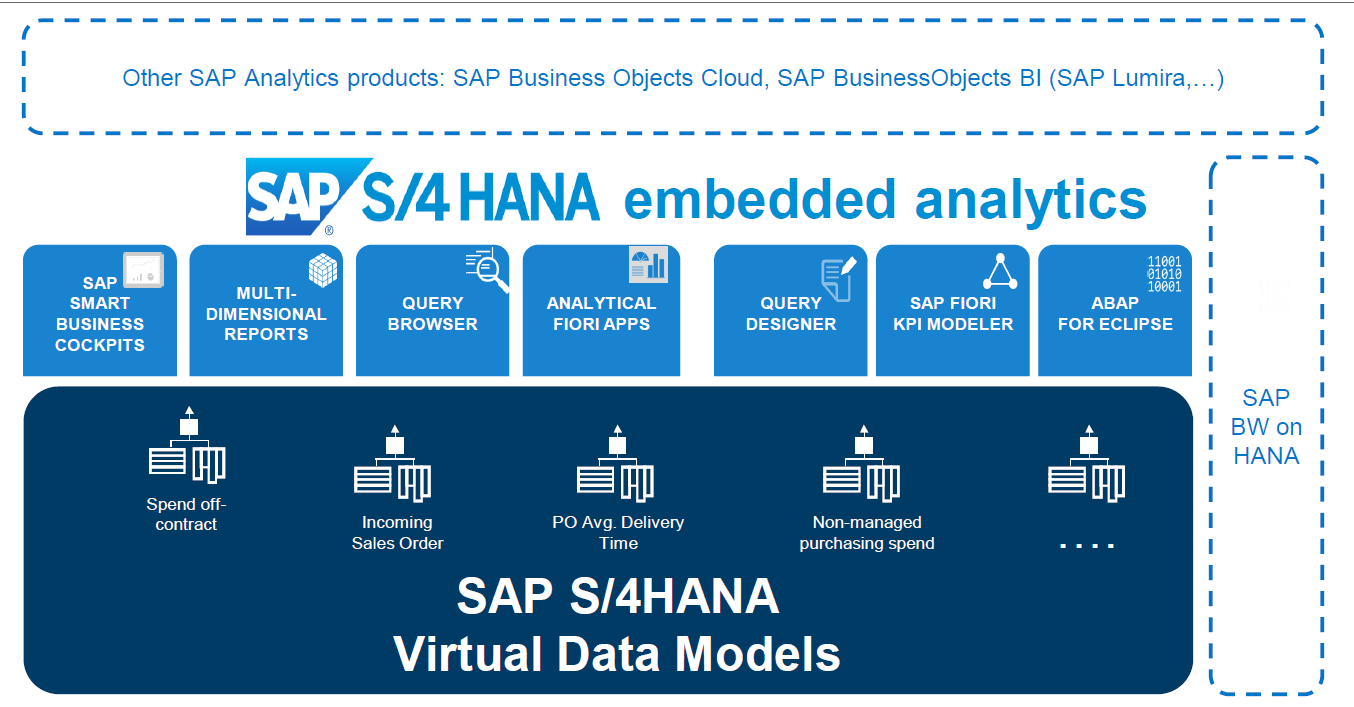
Seamless integration to other SAP Analytical offerings
Below you will see a simple representation of the embedded analytics architecture in S/4HANA. In the top layer you see the SAP Analytical offerings which are seamlessly integrated to the business suite. This means that there is no data load or ETL processes. Data can be consumed in real time in of the mentioned SAP analytical tools. As mentioned before, in this blog I will give examples of both out of the box reporting possibilities (Smart Business, Fiori etc.) and tools from the SAP BO suite (Lumira, Excel).
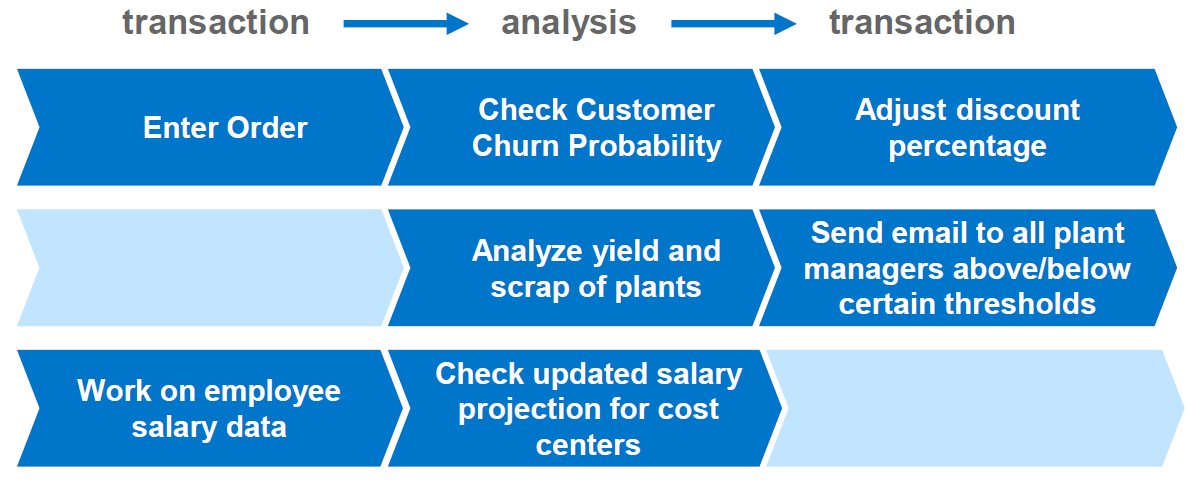
Implementation of embedded analytics a seamless integration of analytical components on the UI
With the implementation of embedded analytics we mean “really” embedded into the transactional work and the daily processes. Today most often transactions and analytics are handled separately, but in reality business processes are a sequence of transactions, analytics, transactions etc.
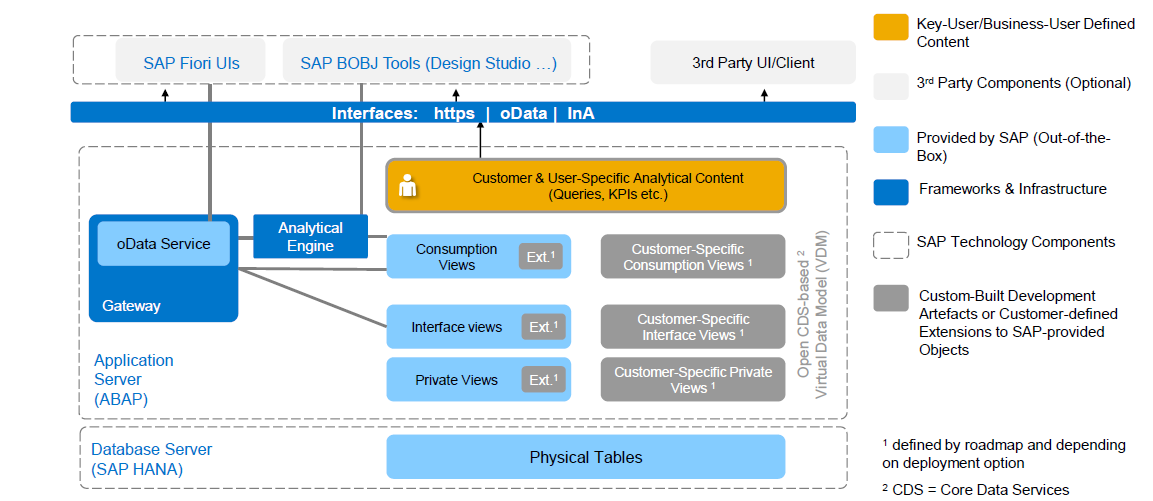
As you can see in the picture below in the architecture everything starts with the physical tables in the database. These are the old fashioned tables like VBRK, VBAP, EKPO, EKKO etc.
On top of that there are Virtual Data Models (VDM’s) built in the Application layer. SAP deploys standard VDM’s out of the box, these can be enriched by customer built specific views. SAP blends transactions and analytics allowing operational reporting on live data. In S/4HANA this concept is supported with Core Data Services (CDS) for real time operational reporting. The content is represented as VDM’s which is based on transactional and master data tables in S/4HANA.
The development of custom views is more often a technical task for developers. However in the application layer there is room for Power/Key users to create own Queries and KPI’s. This is done with the help of the KPI Modeller framework and Self-Service Query Designer.
At the top we see the different user interfaces which can consume the VDM’s. the user interface communicates with the application layer through oData Services. The most obvious and out of the box available user interface is Fiori. Next to that we have the other SAP Analytical offerings in the Business Objects suite (Lumira, Excel, Design Studio, etc.). Even 3rd party user interfaces can consume the virtual data models from the SAP application server.
Perhaps some of you have already hands-on experience with HANA live views in the world of Suite on HANA or Simple Finance. I have worked with Live views a lot. In S/4HANA HANA Live Views are still supported, but CDS views are the way forward. There will be no investment in live views from SAP in S/4HANA and everything is built around CDS views. Let me try to explain some differences between these two and let me try to point out the advantages of CDS views. Because HANA Live Views have a couple of major disadvantages.
First of all CDS views are in the application layer while HANA Live views are in the Database layer. What does this mean? Because CDS views are in the application layer we have the following advantages in contrast to HANA Live views:
Especially the last two are huge benefits. Authorizations and hierarchies are a pain in the neck in HANA Live. I learned this the hard way.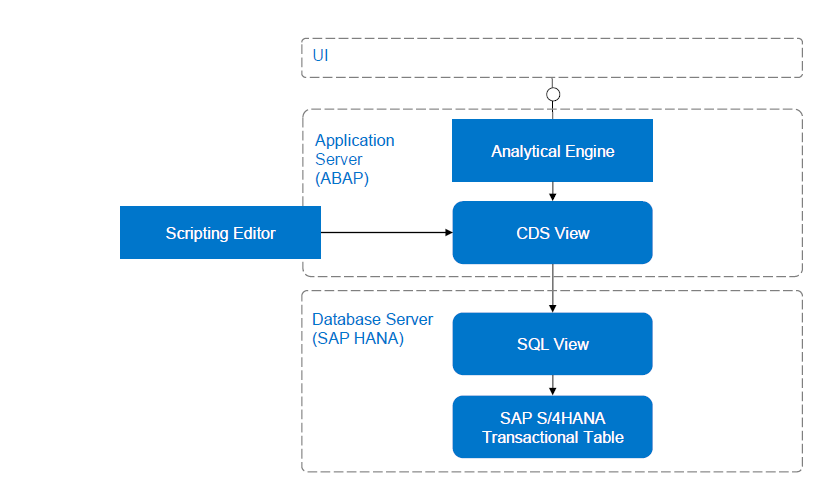
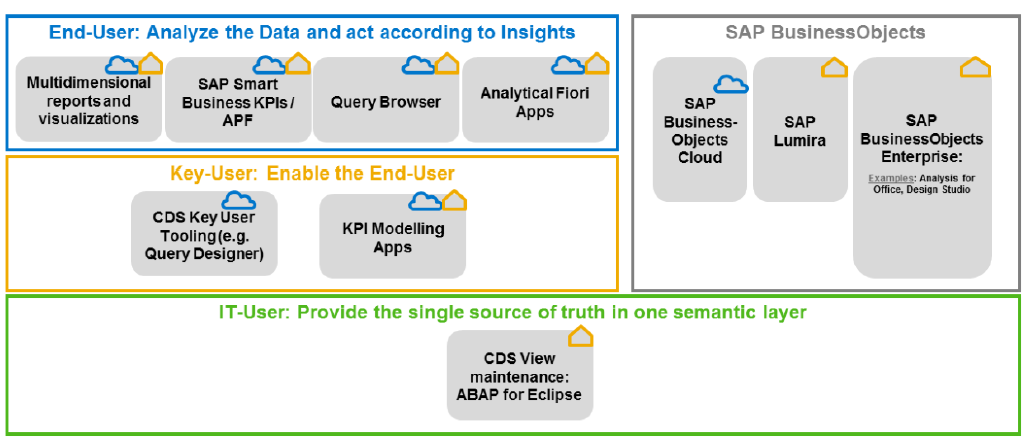
In the below overview you can see the analytical tools available for the type of users. Like in the architecture picture, we start at the bottom where we have the CDS views which are built on top of the database tables.
Let’s read this bottom up:

Some additional information about the availability of analytical apps per release and module.

Now let’s have a look at examples per analytical tooling. I have recorded some demo videos per tool. Go to www.s4hanablog.com to watch the demo videos.
There are demo videos on the below topics.
Multi Dimensional Reporting:
- Incoming Sales Order
Analytical Fiori Apps
- Sales order fulfillment issues
- Customer 360 with navigation to accounting document, correspondence and sales order fulfillment issue
- Display Financial Statement
- Production Cost Analysis
Overview Pages with drill down to Analytical Path Framework (APF apps)
- Procurement Overview Page
- Order to Cash Overview Page
Smart Business Apps
- Overdue Receivables
Analytical Path Framework Apps
- Days Sales Outstanding (dso)
Query Browser
- Query browser with Design Studio
Lumira
- Example Service order reporting
Analysis for Office
- Example Service Order Reporting based on ACDOCA and Maintenance Order tables
- Example Maintenance Contract Reporting based on ACDOCA and sales contract tables
- Example Revenue and Margin Reporting based on billing document item query
In most of the ERP implementations I see that the reporting requirements and workshops are done at the end of the project. It's like saving the best for last, but in reality business processes cannot be separated from analytics. At least when we talk about operational reporting. Other major issues I see are system design and configuration which at the end does not match the reporting requirements. The system is not designed and configured with the desired output (reports) in mind and you will only find this out during the analytics/reporting workshop which are planned at the end of the project.
With the rich analytics content which comes out of the box with S/4HANA this can be improved significantly when it comes to operational reporting. Reports and dashboard do make more sense for users when it’s visualized in a user friendly interface like Fiori. With embedded analytics in S/4HANA SAP makes a huge step forwards in the integration of the transactional and analytical world.
3 principles of Analytics in S/4HANA
- Consistent user experience across all analytical use cases
- Seamless integration to other SAP Analytical offerings
- Implementation of embedded analytics a seamless integration of analytical components on the UI
Consistent user experience across all analytical use cases
To explain this principles further. With consistent user experience we main to say that even applications with different use cases should work the same way for e.g. filtering, printing, data export, role based access etc.
Seamless integration to other SAP Analytical offerings
Below you will see a simple representation of the embedded analytics architecture in S/4HANA. In the top layer you see the SAP Analytical offerings which are seamlessly integrated to the business suite. This means that there is no data load or ETL processes. Data can be consumed in real time in of the mentioned SAP analytical tools. As mentioned before, in this blog I will give examples of both out of the box reporting possibilities (Smart Business, Fiori etc.) and tools from the SAP BO suite (Lumira, Excel).
Implementation of embedded analytics a seamless integration of analytical components on the UI
With the implementation of embedded analytics we mean “really” embedded into the transactional work and the daily processes. Today most often transactions and analytics are handled separately, but in reality business processes are a sequence of transactions, analytics, transactions etc.
S/4HANA Real Time Analytics Architecture
As you can see in the picture below in the architecture everything starts with the physical tables in the database. These are the old fashioned tables like VBRK, VBAP, EKPO, EKKO etc.
On top of that there are Virtual Data Models (VDM’s) built in the Application layer. SAP deploys standard VDM’s out of the box, these can be enriched by customer built specific views. SAP blends transactions and analytics allowing operational reporting on live data. In S/4HANA this concept is supported with Core Data Services (CDS) for real time operational reporting. The content is represented as VDM’s which is based on transactional and master data tables in S/4HANA.
The development of custom views is more often a technical task for developers. However in the application layer there is room for Power/Key users to create own Queries and KPI’s. This is done with the help of the KPI Modeller framework and Self-Service Query Designer.
At the top we see the different user interfaces which can consume the VDM’s. the user interface communicates with the application layer through oData Services. The most obvious and out of the box available user interface is Fiori. Next to that we have the other SAP Analytical offerings in the Business Objects suite (Lumira, Excel, Design Studio, etc.). Even 3rd party user interfaces can consume the virtual data models from the SAP application server.
Difference between HANA Live Views and CDS Views
Perhaps some of you have already hands-on experience with HANA live views in the world of Suite on HANA or Simple Finance. I have worked with Live views a lot. In S/4HANA HANA Live Views are still supported, but CDS views are the way forward. There will be no investment in live views from SAP in S/4HANA and everything is built around CDS views. Let me try to explain some differences between these two and let me try to point out the advantages of CDS views. Because HANA Live Views have a couple of major disadvantages.
First of all CDS views are in the application layer while HANA Live views are in the Database layer. What does this mean? Because CDS views are in the application layer we have the following advantages in contrast to HANA Live views:
- Full ABAP lifecycle integration
- Part of the General Extensibility concept
- Supporting ERP Authorizations
- Supporting ERP Hierarchies
Especially the last two are huge benefits. Authorizations and hierarchies are a pain in the neck in HANA Live. I learned this the hard way.
Embedded Analytics offerings per type of user
In the below overview you can see the analytical tools available for the type of users. Like in the architecture picture, we start at the bottom where we have the CDS views which are built on top of the database tables.
Let’s read this bottom up:
Available Analytical Apps by Release
Some additional information about the availability of analytical apps per release and module.
Demo per analytical tooling
Now let’s have a look at examples per analytical tooling. I have recorded some demo videos per tool. Go to www.s4hanablog.com to watch the demo videos.
There are demo videos on the below topics.
Multi Dimensional Reporting:
- Incoming Sales Order
Analytical Fiori Apps
- Sales order fulfillment issues
- Customer 360 with navigation to accounting document, correspondence and sales order fulfillment issue
- Display Financial Statement
- Production Cost Analysis
Overview Pages with drill down to Analytical Path Framework (APF apps)
- Procurement Overview Page
- Order to Cash Overview Page
Smart Business Apps
- Overdue Receivables
Analytical Path Framework Apps
- Days Sales Outstanding (dso)
Query Browser
- Query browser with Design Studio
Lumira
- Example Service order reporting
Analysis for Office
- Example Service Order Reporting based on ACDOCA and Maintenance Order tables
- Example Maintenance Contract Reporting based on ACDOCA and sales contract tables
- Example Revenue and Margin Reporting based on billing document item query
2 Comments
You must be a registered user to add a comment. If you've already registered, sign in. Otherwise, register and sign in.
Labels in this area
-
"mm02"
1 -
A_PurchaseOrderItem additional fields
1 -
ABAP
1 -
ABAP Extensibility
1 -
ACCOSTRATE
1 -
ACDOCP
1 -
Adding your country in SPRO - Project Administration
1 -
Advance Return Management
1 -
AI and RPA in SAP Upgrades
1 -
API and Integration
1 -
Approval Workflows
1 -
Ariba
1 -
ARM
1 -
ASN
1 -
Asset Management
1 -
Associations in CDS Views
1 -
auditlog
1 -
Authorization
1 -
Availability date
1 -
Azure Center for SAP Solutions
1 -
AzureSentinel
2 -
Bank
1 -
BAPI_SALESORDER_CREATEFROMDAT2
1 -
BRF+
1 -
BRFPLUS
1 -
Bundled Cloud Services
1 -
business participation
1 -
Business Processes
1 -
CAPM
1 -
Carbon
1 -
Cental Finance
1 -
CFIN
1 -
CFIN Document Splitting
1 -
Cloud ALM
1 -
Cloud Integration
1 -
condition contract management
1 -
Connection - The default connection string cannot be used.
1 -
Custom Table Creation
1 -
Customer Screen in Production Order
1 -
Customizing
1 -
Data Quality Management
1 -
Date required
1 -
Decisions
1 -
desafios4hana
1 -
Developing with SAP Integration Suite
2 -
Direct Outbound Delivery
1 -
DMOVE2S4
1 -
EAM
1 -
EDI
3 -
EDI 850
1 -
EDI 856
1 -
edocument
1 -
EHS Product Structure
1 -
Emergency Access Management
1 -
Employee Central Integration (Inc. EC APIs)
1 -
Energy
1 -
EPC
1 -
Financial Operations
1 -
Find
1 -
FINSSKF
1 -
Fiori
1 -
Flexible Workflow
1 -
Gas
1 -
Gen AI enabled SAP Upgrades
1 -
General
1 -
generate_xlsx_file
1 -
Getting Started
1 -
HomogeneousDMO
1 -
How to add new Fields in the Selection Screen Parameter in FBL1H Tcode
1 -
IDOC
2 -
Integration
1 -
Learning Content
2 -
Ledger Combinations in SAP
1 -
LogicApps
2 -
low touchproject
1 -
Maintenance
1 -
management
1 -
Material creation
1 -
Material Management
1 -
MD04
1 -
MD61
1 -
methodology
1 -
Microsoft
2 -
MicrosoftSentinel
2 -
Migration
1 -
mm purchasing
1 -
MRP
1 -
MS Teams
2 -
MT940
1 -
Newcomer
1 -
Notifications
1 -
Oil
1 -
open connectors
1 -
Order Change Log
1 -
ORDERS
2 -
OSS Note 390635
1 -
outbound delivery
1 -
outsourcing
1 -
PCE
1 -
Permit to Work
1 -
PIR Consumption Mode
1 -
PIR's
1 -
PIRs
1 -
PIRs Consumption
1 -
PIRs Reduction
1 -
Plan Independent Requirement
1 -
POSTMAN
1 -
Premium Plus
1 -
pricing
1 -
Primavera P6
1 -
Process Excellence
1 -
Process Management
1 -
Process Order Change Log
1 -
Process purchase requisitions
1 -
Product Information
1 -
Production Order Change Log
1 -
purchase order
1 -
Purchase requisition
1 -
Purchasing Lead Time
1 -
Redwood for SAP Job execution Setup
1 -
RISE with SAP
1 -
RisewithSAP
1 -
Rizing
1 -
S4 Cost Center Planning
1 -
S4 HANA
1 -
S4HANA
3 -
S4HANACloud audit
1 -
Sales and Distribution
1 -
Sales Commission
1 -
sales order
1 -
SAP
2 -
SAP Best Practices
1 -
SAP Build
1 -
SAP Build apps
1 -
SAP CI
1 -
SAP Cloud ALM
1 -
SAP CPI
1 -
SAP CPI (Cloud Platform Integration)
1 -
SAP Data Quality Management
1 -
SAP ERP
1 -
SAP Maintenance resource scheduling
2 -
SAP Note 390635
1 -
SAP S4HANA
2 -
SAP S4HANA Cloud private edition
1 -
SAP Upgrade Automation
1 -
SAP WCM
1 -
SAP Work Clearance Management
1 -
Schedule Agreement
1 -
SDM
1 -
security
2 -
Settlement Management
1 -
soar
2 -
Sourcing and Procurement
1 -
SSIS
1 -
SU01
1 -
SUM2.0SP17
1 -
SUMDMO
1 -
Teams
2 -
Time Management
1 -
User Administration
1 -
User Participation
1 -
Utilities
1 -
va01
1 -
vendor
1 -
vl01n
1 -
vl02n
1 -
WCM
1 -
X12 850
1 -
xlsx_file_abap
1 -
YTD|MTD|QTD in CDs views using Date Function
1
- « Previous
- Next »
Related Content
- SAP S4HANA Cloud Public Edition Logistics FAQ in Enterprise Resource Planning Blogs by SAP
- Building Low Code Extensions with Key User Extensibility in SAP S/4HANA and SAP Build in Enterprise Resource Planning Blogs by SAP
- Demystifying Transformers and Embeddings: Some GenAI Concepts in Enterprise Resource Planning Blogs by SAP
- Embedded Analytics standard content available for the Cloud for Customer data in S4 hana system in Enterprise Resource Planning Q&A
- Continuous Influence Session SAP S/4HANA Cloud, private edition: Results Review Cycle for Q4 2023 in Enterprise Resource Planning Blogs by SAP
Top kudoed authors
| User | Count |
|---|---|
| 3 | |
| 2 | |
| 2 | |
| 2 | |
| 2 | |
| 1 | |
| 1 | |
| 1 | |
| 1 |