
In this blog post, we’re going to present the new
Shop Administrator demo app to you – a showcase for the
sap.tnt library. This library contains controls to build tools using the SAP Fiori design language. The Shop Administrator demo app shows you how to build a tool to manage an online shop like our
Shopping Cart demo app.
The Tool Page screen is divided into three main sections:
- Tool header: located at the top of the screen with a set of buttons for displaying errors, notifications, and user information.
- Side navigation: located on the left side of the screen. You can use it to navigate between the different pages in your application. At the bottom of the side navigation panel, you can add links to important things such as legal information.
- Content area: located in the middle of the screen, use it to show the contents of each page.

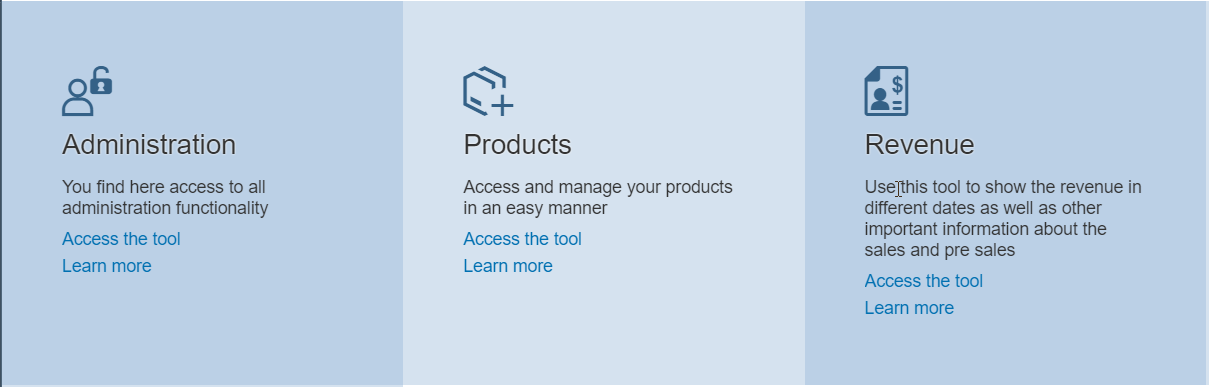
The home page gives you a good example of how to use and implement the Block Layout and how to arrange the controls using smaller blocks called Block Layout Cells nested inside Block Layout Rows.
The Block Layout comes with five different flavors: Accent, Dashboard, Mixed, Light, and Default. Each affects the color of the rows and cells. For the home page, we chose the Light flavor to color the cells in lightweight blue tones as you can see in the following screenshot.
You can change the design according to your needs. Check out the
Block Layout Explored sample.
If you like to have more information about the design itself, take a look at the
SAP Fiori Design Guidelines.
The settings page shows a good example of how to use and implement the Object Page Layout control to show a set of inputs. The
Object Page Layout enables you to use the concept of sections, to help you scroll easily and move from one section to another in a single click without moving the toolbar.

The statistics page shows various types of charts that you can use to show different types of data. We’re going to explain this in detail in another blog post, so stay tuned…
I hope this post inspired your curiosity for Block Layout. We’ll keep you in the loop for more news straight from the SAPUI5/OpenUI5 lab.
How are we doing? Let us know by leaving a comment here or contacting us in the
slack channel.
Previous Post:
UI5ers Buzz #02
Next post:
UI5ers Buzz #04
Cheers,
Ayham
 |
Ayham is an OpenUI5 developer. His interests are developing Web applications using cutting edge technologies. He is not limited to software development but also experienced with networks. |

