Technical Articles
BPC 10.1 Embedded – how the new exit for displaying structure members can be used for setting up a rolling forecast
In our blog BPC 10.1 Embedded: How to efficiently realize a rolling forecast scenario we have described how a rolling forecast can be achieved using a BPC Embedded scenario. We have described that there is one option where you create all possibly necessary structure elements (columns) in your query and then use the display variable to display only those columns that are necessary at the given time. The single values in the variable must be selected manually. Obviously, this procedure is quite cumbersome and error prone especially when the query contains many structure elements.
With note 2407049 (also have a look at note 2133546 as prerequisite) we introduce the option to use an (non-input enabled) exit variable instead. Thus, the correct structure elements can be chosen automatically by the system. The end user does not have to care about setting the variable and cannot choose the wrong columns.
To set up the query you must use the new BW modeling tool (Eclipse based).
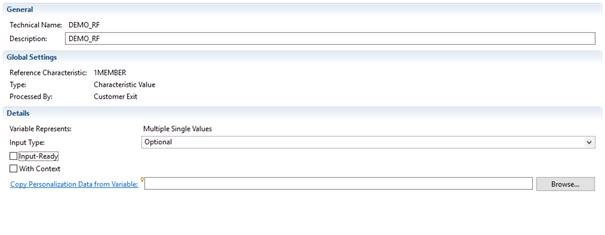
First you should create a new variable for your visibility filter. Use the context menu on the name of your BW system, choose ‘New’ and then ‘Variable’ (if ‘Variable’ is not visible directly go to ‘New->BW Object->Variable’). Create a variable based on the technical characteristic ‘1MEMBER’. Note that the variable type MUST be ‘Customer Exit’. If you want you can make the variable input enabled.
This is an example how your variable could look like:
Now open your query in the BW Modeling Tools (not BEx Query Designer).
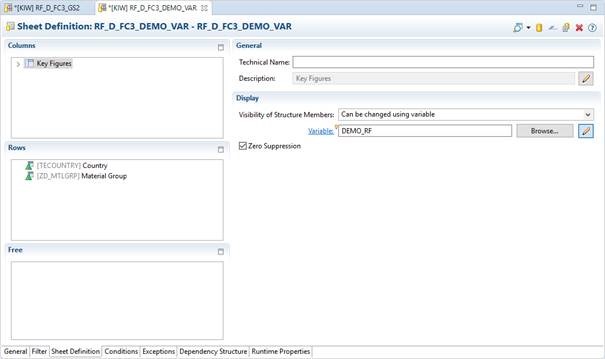
Click on ‘key figures’ in the column. On the right-hand side under ‘Display’ choose ‘Can be changed using variables’.
Click the change button on the right and either enter the name of your variable directly or use the browse button:
Now for each of the structure elements you should enter a technical name (in a normal query this is not necessary):
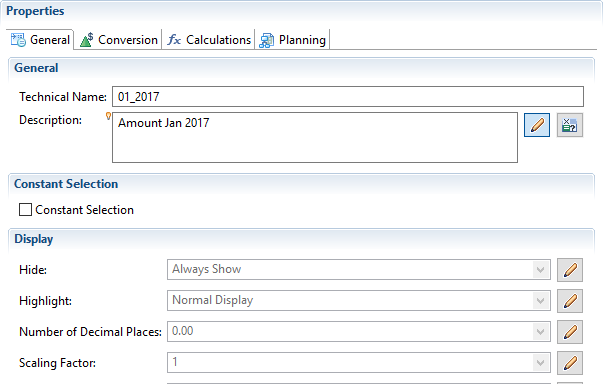
We want to follow our example of a rolling forecast. This is the list of the structure elements we create:
Now create the standard BW variable exit. If a certain column should be visible, then the exit must return the key of this column. If for example, we are have to plan starting from April 2017 the exit would return the keys for the structure elements for April 2017, May 2017,…, March 2018, Q2 2018, Q3 2018, and Q4 2018.
You could either hard code the logic we have just described or you can make the coding more generic as we have done in our example:
When executing the query the structure is automatically adapted so without user interaction we get to correct setup for the rolling forecast.
When you display the design panel you can see that there is a filter on the measures in the columns. Click on measure and you will see which structure elements are displayed by the exit variable and which columns are disabled.
Hi Gerd,
Wouldn't you need to change the query every year if using this approach?
Is it not possible to use Text Variable for each key figure instead, so it can be like:
...
Selection Month -2
Selection Month -1
Selection Month
Selection Month +1
Selection Month +2
...
I think this should be more flexible to design.
Though I find it interesting that now there's a functionality to filter key figures by using a variable.
Could you explain how this code works?
Because I see that for example, for l_cur_month = 4, then the variable output will be 4_2017.
How did this translate into Amount Apr 2017?
Hi Donnie,
Well sure - the example I have used is simplified to make it easier to understand the idea behind the new feature. What I would do differently in a real-live project is:
So how does the system find the correct key for a dedicated structure element? As visible in the third screen shot every structure element must have a key. In my naming convention the structure elements are called ‘01_2017’, ‘02_2017’, …
Now in the coding example the variable l_cur_month is a two digit numeric field. Thus, after the statement ‘l_cur_month = 4’ the variable l_cur_month contains the value ‘04’ and thus the generated key is ‘04_2017’ which is the key for ‘Amount April 2017’. Again, this might be a place where a little polishing would make the ABAP coding more sophisticated.
Best regards, Gerd
Hello,
I could not find option to select variable. I want to fill it by user-exit.
Do I have to make additional setup? In RS_FRONTEND_INIT for expl?
NW 7.4 SP 17
BW MT 1.18
Hi Gerd,
Would this approach work if I have a Drill-down characteristic above the structure instead of listing all 28 columns?
Thank you,
Gersh
Hi Gersh,
It depends on the situation but probably not. You can set a structure member invisible. Now if you have a characteristic drilled 'above' the structure then you would either suppress all columns of structure member 1 or of member 2. Thus (in our above example) you would only get actual data or only plan data.
There might be other business scenarios where this technique might lead to the desired behavior. But not in our example...
Best regards,
Gerd
Hi Gerd,
This variable basically sets those columns to "hidden, can be shown" state . Is there a way to set them to state "hidden, can't be shown"?
Thank you,
Gersh
Hi Gersh,
No, unfortunately not...;-)
Best regards,
Gerd
Hi Gerd,
We need to use such structures in multiple Queries. When we save the structure as Global it looses the variable; when we pull the structure to a Query it doesn't allow assigning Visibility variable. Do you know if this is a bug or by design? Is the only way to make it work is Deference it?
Thank you,
Gersh
Hi Gersh,
Currently this is unfortunately not yet possible.
Best regards,
Gerd
Hi Gerd,
At tech-ed 2017, you and Detlef had an excellent example in the training session for ANA260 (page 63++). Is it possible for you to share the details on how the underlying queries were created?
Best Regards,
Lars
Hi Lars,
The solution showed at Teched was actually using a different technique. There we did not bring actual data and plan data into ONE query and made the query react dynamically to the given date (as in this blog) but we were using two queries: one for the actual data with an interval selection for the month and the month drilled down in the columns and a second query for the plan data, again with an interval selection for the month and the month in the columns. This second query was using 'create combination' such that we would obtain also the empty plan columns. In Analysis for Office we used the feature 'combine crosstab' to make the two queries look like one query on the screen. To be more precis we actually used a third query for the following years but that does not change the underlying concept.
This approach has also been explained in my blog about how to realize a rolling forecast (see link in the first line of the current blog).
Best regards,
Gerd
Awsome blog post !!