
- SAP Community
- Products and Technology
- Technology
- Technology Blogs by SAP
- Creating a Calculation View Based on the Table of ...
Technology Blogs by SAP
Learn how to extend and personalize SAP applications. Follow the SAP technology blog for insights into SAP BTP, ABAP, SAP Analytics Cloud, SAP HANA, and more.
Turn on suggestions
Auto-suggest helps you quickly narrow down your search results by suggesting possible matches as you type.
Showing results for
former_member28
Explorer
Options
- Subscribe to RSS Feed
- Mark as New
- Mark as Read
- Bookmark
- Subscribe
- Printer Friendly Page
- Report Inappropriate Content
03-15-2017
4:54 AM
In this blog post, we will make a HANA Calculation View based on the SAP Cloud Platform IoTMMS table that we set-up to receive sensor data.
Usually, the data that comes from sensors need to be shaped and filtered in a specific way for the most optimized consumption by the charts. Depending on the use case, this can be achieved in different parts of the IoT pipeline. In our case, we will create a Calculation View to modify our data so that it can be easily consumed by a visualization tool; SAP BusinessObjects Cloud.
Pre-requirements:
1- You have access to an HCP account (trial also works) & your user has permissions to use the Web development Workbench
2 - The SAP HANA user must be assigned the INA_USER role and "Select" privileges on the tables we will use (see these pre-reqs).
3- You have HANA Studio and installed with
NOTE: You can also do this tutorial by using the SAP HANA Web-based Development Workbench instead of HANA Studio.
Credentials:
You will need the following credentials:
0 - HCP Setup & Overview:
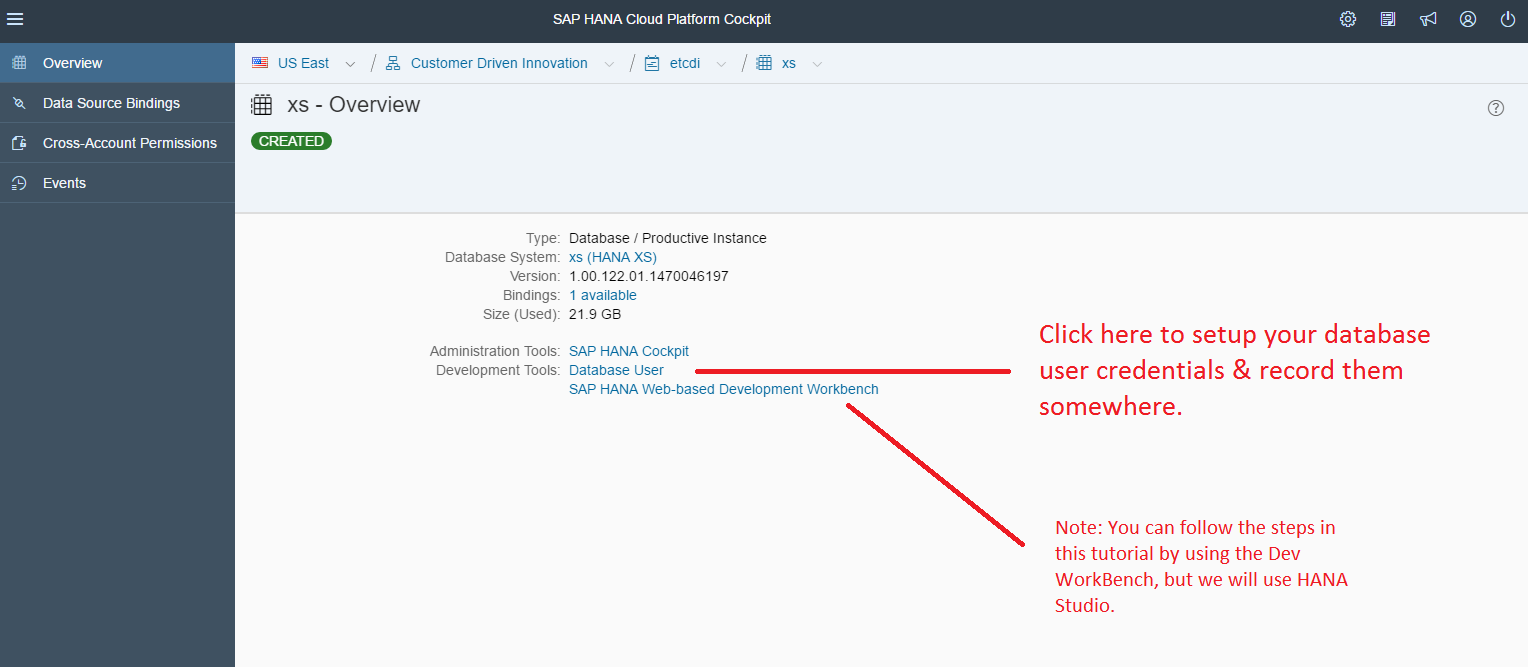
0.1 - Go to your SAP Cloud Platform account overview page and make note of the highlighted information. You will use it to log in to HANA Cloud Tools.

0.2 - Note down your database name and click on the database.

0.3 - Click on Database User and setup your Database User. THIS STEP CAN ONLY BE DONE ONCE! Make sure to note down the username and password.
1 - Setting up SAP Cloud Platform authentication on HANA Studio:
1.1 - Open HANA Studio and switch to the SAP HANA Administration Console view.

1.2 - Add a Cloud System. If you don't see this view, click Window->Show View -> Systems

1.3 - Enter your HCP credentials. Landscape host and HCP Account Name can be found in step 0.1. You need to enter your SAP Cloud Platform Dev username & password here, it may not be same as your general HCP credentials.
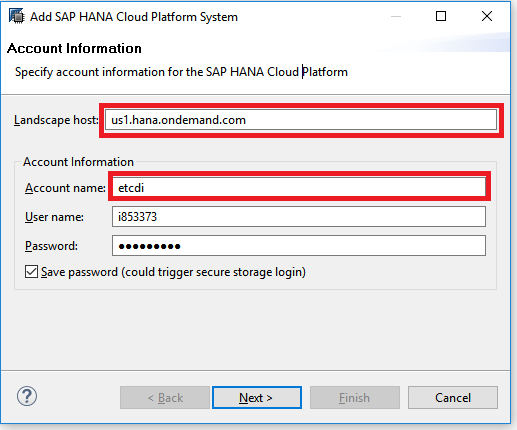
1.4 - Enter your Database User credentials. You have set this up in step 0.3.If all goes well, you will see your account name on the systems console.
2 - Creating a Calculation View based on the IoTMMS Table
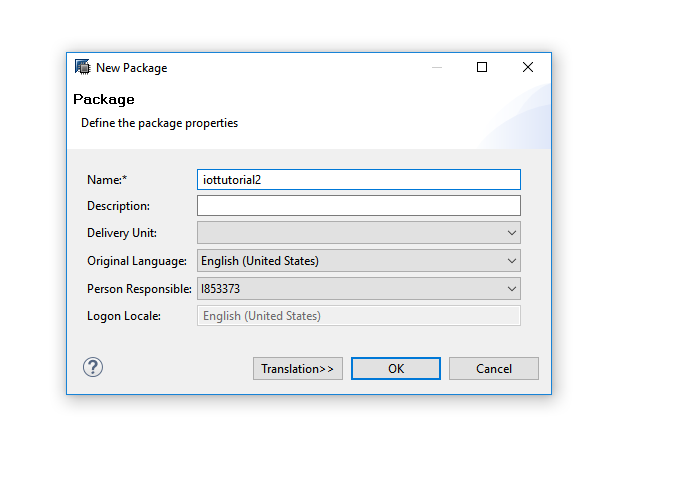
2.1 - Create a package under the "Content" folder.

2.2 - Enter package details. We will use the name iottutorial2 for this package.
2.3 - Create a Calculation View in this package. Views shape & modify the data in some given format before they are consumed in charts.

2.4 - Enter the calculation view details.

2.5 - Double Click on your calculation view under your package and you should see the visual editor below. Hover on the Aggregation box and click on the plus that will appear. Click on the plus sign to add a table to be aggregated.

2.6 - Search and find the table which has your data. If you have done the IoT tutorial in Part-1, search for "t_iot" and you can find the table. If all goes well, you should see the existing fields/columns of the table (as shown in the next step).
Note: If you are not the owner of the table you want to use, you will need the table's owner to give your user "select" privileges on the table. You can see the owner's details in parenthesis right next to the table.You may need to do this if the SAP Cloud Platform IoTMMS was not created under your name.

2.7 - Add the columns you want to the output of your view. These are the columns that you view will make available to whatever component that will consume that view. For this tutorial, we will add all existing fields to output.

2.8 - If all goes well, you will see your fields in the output section on the right. Click on semantics to see the editor for the fields.

2.9 - Edit the types of your fields as shown in the picture. Here you can determine the types of your fields, add rules & calculations to modify/filter/aggregate the data. We will set the types and continue without modifying the data.
Measure type represents a numeric measure and attribute represents a category or a label that describes that measure. For example, temperature could be a numeric measure, and its attributes can be city, date or measuring device. You will want to set at least one field to be an "Attribute".
NOTE: Another commonly used term for Attribute is Dimension.

2.10 - Save your view, right click on your view and validate it to make sure there are no errors. Then, right click again and activate it. If there are any errors, they will be shown in the console at the bottom.

2.11 - Repeat the same steps and activate your view. Make sure the right view is selected for activating.

2.12 - You can now preview the data in your view. Right click on your view and click on preview.

2.13 - If all went well, you will see the data from the table in your output. This means that the view is ready to be consumed by other components.

Now our data is ready to be visualized. For consuming this view via Live Data Connection from SAP BusinessObjects Cloud, continue to the last part of this tutorial.
This is the part-2 of a 3-part tutorial. Here are the other parts:
Sending Sensor Data to SAP Cloud Platform by using the IoT Message Management Service (IoTMMS) - Fro...
Establishing Live Data Connection to HANA Views From SAP BusinessObjects Cloud - From Sensor to Clou...
Usually, the data that comes from sensors need to be shaped and filtered in a specific way for the most optimized consumption by the charts. Depending on the use case, this can be achieved in different parts of the IoT pipeline. In our case, we will create a Calculation View to modify our data so that it can be easily consumed by a visualization tool; SAP BusinessObjects Cloud.
Pre-requirements:
1- You have access to an HCP account (trial also works) & your user has permissions to use the Web development Workbench
2 - The SAP HANA user must be assigned the INA_USER role and "Select" privileges on the tables we will use (see these pre-reqs).
3- You have HANA Studio and installed with
- SAP Cloud Platform Tools
- SAP HANA Tools
- if not, you can follow the steps here and select the SAP Eclipse/Mars directory (or a later version of Eclipse)
NOTE: You can also do this tutorial by using the SAP HANA Web-based Development Workbench instead of HANA Studio.
Credentials:
You will need the following credentials:
- SAP Cloud Platform username & password
- SAP Cloud Platform Dev User username & password
- this is provided to you by your SAP Cloud Platform admin and you will use it to login to HANA Cloud Tools or Development Workbench. It may or may not be the same as your HCP login credentials
- HANA Database User username & password
- You will set this up yourself by following the steps below
- HANA DB Name & System
0 - HCP Setup & Overview:
0.1 - Go to your SAP Cloud Platform account overview page and make note of the highlighted information. You will use it to log in to HANA Cloud Tools.
0.2 - Note down your database name and click on the database.
0.3 - Click on Database User and setup your Database User. THIS STEP CAN ONLY BE DONE ONCE! Make sure to note down the username and password.
1 - Setting up SAP Cloud Platform authentication on HANA Studio:
1.1 - Open HANA Studio and switch to the SAP HANA Administration Console view.
1.2 - Add a Cloud System. If you don't see this view, click Window->Show View -> Systems
1.3 - Enter your HCP credentials. Landscape host and HCP Account Name can be found in step 0.1. You need to enter your SAP Cloud Platform Dev username & password here, it may not be same as your general HCP credentials.
1.4 - Enter your Database User credentials. You have set this up in step 0.3.If all goes well, you will see your account name on the systems console.
2 - Creating a Calculation View based on the IoTMMS Table
2.1 - Create a package under the "Content" folder.
2.2 - Enter package details. We will use the name iottutorial2 for this package.
2.3 - Create a Calculation View in this package. Views shape & modify the data in some given format before they are consumed in charts.
2.4 - Enter the calculation view details.
2.5 - Double Click on your calculation view under your package and you should see the visual editor below. Hover on the Aggregation box and click on the plus that will appear. Click on the plus sign to add a table to be aggregated.
2.6 - Search and find the table which has your data. If you have done the IoT tutorial in Part-1, search for "t_iot" and you can find the table. If all goes well, you should see the existing fields/columns of the table (as shown in the next step).
Note: If you are not the owner of the table you want to use, you will need the table's owner to give your user "select" privileges on the table. You can see the owner's details in parenthesis right next to the table.You may need to do this if the SAP Cloud Platform IoTMMS was not created under your name.
2.7 - Add the columns you want to the output of your view. These are the columns that you view will make available to whatever component that will consume that view. For this tutorial, we will add all existing fields to output.
2.8 - If all goes well, you will see your fields in the output section on the right. Click on semantics to see the editor for the fields.
2.9 - Edit the types of your fields as shown in the picture. Here you can determine the types of your fields, add rules & calculations to modify/filter/aggregate the data. We will set the types and continue without modifying the data.
Measure type represents a numeric measure and attribute represents a category or a label that describes that measure. For example, temperature could be a numeric measure, and its attributes can be city, date or measuring device. You will want to set at least one field to be an "Attribute".
NOTE: Another commonly used term for Attribute is Dimension.
2.10 - Save your view, right click on your view and validate it to make sure there are no errors. Then, right click again and activate it. If there are any errors, they will be shown in the console at the bottom.
2.11 - Repeat the same steps and activate your view. Make sure the right view is selected for activating.
2.12 - You can now preview the data in your view. Right click on your view and click on preview.
2.13 - If all went well, you will see the data from the table in your output. This means that the view is ready to be consumed by other components.
Now our data is ready to be visualized. For consuming this view via Live Data Connection from SAP BusinessObjects Cloud, continue to the last part of this tutorial.
This is the part-2 of a 3-part tutorial. Here are the other parts:
Sending Sensor Data to SAP Cloud Platform by using the IoT Message Management Service (IoTMMS) - Fro...
Establishing Live Data Connection to HANA Views From SAP BusinessObjects Cloud - From Sensor to Clou...
- SAP Managed Tags:
- SAP Analytics Cloud,
- SAP Business Technology Platform
2 Comments
You must be a registered user to add a comment. If you've already registered, sign in. Otherwise, register and sign in.
Labels in this area
-
ABAP CDS Views - CDC (Change Data Capture)
2 -
AI
1 -
Analyze Workload Data
1 -
BTP
1 -
Business and IT Integration
2 -
Business application stu
1 -
Business Technology Platform
1 -
Business Trends
1,661 -
Business Trends
87 -
CAP
1 -
cf
1 -
Cloud Foundry
1 -
Confluent
1 -
Customer COE Basics and Fundamentals
1 -
Customer COE Latest and Greatest
3 -
Customer Data Browser app
1 -
Data Analysis Tool
1 -
data migration
1 -
data transfer
1 -
Datasphere
2 -
Event Information
1,400 -
Event Information
64 -
Expert
1 -
Expert Insights
178 -
Expert Insights
275 -
General
1 -
Google cloud
1 -
Google Next'24
1 -
Kafka
1 -
Life at SAP
784 -
Life at SAP
11 -
Migrate your Data App
1 -
MTA
1 -
Network Performance Analysis
1 -
NodeJS
1 -
PDF
1 -
POC
1 -
Product Updates
4,577 -
Product Updates
329 -
Replication Flow
1 -
RisewithSAP
1 -
SAP BTP
1 -
SAP BTP Cloud Foundry
1 -
SAP Cloud ALM
1 -
SAP Cloud Application Programming Model
1 -
SAP Datasphere
2 -
SAP S4HANA Cloud
1 -
SAP S4HANA Migration Cockpit
1 -
Technology Updates
6,886 -
Technology Updates
407 -
Workload Fluctuations
1
Related Content
- SAP HANA Cloud Vector Engine: Quick FAQ Reference in Technology Blogs by SAP
- 10+ ways to reshape your SAP landscape with SAP Business Technology Platform - Blog 7 in Technology Blogs by SAP
- 10+ ways to reshape your SAP landscape with SAP BTP - Blog 4 Interview in Technology Blogs by SAP
- 10+ ways to reshape your SAP landscape with SAP Business Technology Platform – Blog 4 in Technology Blogs by SAP
- Top Picks: Innovations Highlights from SAP Business Technology Platform (Q1/2024) in Technology Blogs by SAP
Top kudoed authors
| User | Count |
|---|---|
| 13 | |
| 10 | |
| 10 | |
| 7 | |
| 7 | |
| 6 | |
| 5 | |
| 5 | |
| 5 | |
| 4 |