

- SAP Community
- Products and Technology
- Technology
- Technology Blogs by Members
- Visualize SAP HANA logs in real time with Open Sta...
Technology Blogs by Members
Explore a vibrant mix of technical expertise, industry insights, and tech buzz in member blogs covering SAP products, technology, and events. Get in the mix!
Turn on suggestions
Auto-suggest helps you quickly narrow down your search results by suggesting possible matches as you type.
Showing results for
Prabhakaran
Explorer
Options
- Subscribe to RSS Feed
- Mark as New
- Mark as Read
- Bookmark
- Subscribe
- Printer Friendly Page
- Report Inappropriate Content
01-23-2017
12:57 PM
Background:
The blog explores an open source tool to monitor HANA logs in real time. Imagine having to monitor and analyse HANA logs to ensure your HANA node is running properly and what if you had many HANA nodes in a cluster environment in your landscape. SAP has introduced SAP ITOA which is a real-time monitoring and analysis tool which is a licensed version which runs on a HANA database, which grabs syslog from different infrastructure components.
What if we could have an open source platform to stream, analysis and monitor your HANA component logs from HANA cluster nodes?
We attempt to introduce a new analytics solution for real time log analysis "Open Stack IT operation analytics" for HANA cluster nodes which is developed in-house with open source tools (ELK stack) to stream, analysis, monitor SAP HANA components.
Benefits of Open Stack IT operation analytics: Stream, analyse the logs and identify critical incidents in real time.
Overview of ELK Stack:
Elastic has created an end-to-end stack called ELK and elastic stack makes searching and analysing of data easier than ever before. Figure-1 represents the ELK stack.
Please refer https://www.elastic.co/ for more information
 Figure 1
Kibana: Kabana gives shape to your data and is the extensible user interface for configuring and managing all aspects of the Elastic Stack.
Elastic search: Elastic search is a distributed, JSON-based search and analytics engine designed for horizontal scalability, maximum reliability, and easy management. With elastic search we can instantly store, search and analyse the data.
Logstash: Ingest any data, from any source, in any format. Logstash is a dynamic data collection pipeline with an extensible plugin ecosystem and strong Elastic search synergy.
Benefits:
- Derive structure from unstructured data with grok
- Decipher geo coordinates from IP addresses
- Anonymize PII data, exclude sensitive fields completely
- Ease overall processing independent of the data source, format, or schema.
Architecture of Open Stack IT Operation Analytics for SAP HANA:

Figure 2
SAP ITOA and Open Stack IT Operation Analytics:
Part 1:Stream, analyse and monitor SAP HANA component logs using ELK Stack
SAP HANA has below core components which availability is critical to the business.
- Name Server
- Index Server
- Pre-processor
- XS Engine
- Web dispatcher
The logging feature of these components can be leveraged by elastic search and can be used to search, analyse, visualize and monitor the resources.As of today the logs are unstructured data, as data travels from source to store, Logstash filters parse each event, identify named fields to build structure, and transform them to converge on a common format for easier, accelerated analysis and business value. Logstash dynamically transforms and prepare your data regardless of format or complexity
Step 1: Download and install the ELK stack packages
1.1 Install Elastic search:
Install the Elastic search with simple steps as mentioned in the below link
https://www.elastic.co/guide/en/elasticsearch/reference/current/_installation.html
1.2 Install Logstash:
Install the logstash with simple steps as mentioned in the below link
https://www.elastic.co/guide/en/logstash/5.x/installing-logstash.html
1.3 Install Kibana:
Install the Kibana with simple steps as mentioned in the below link
https://www.elastic.co/guide/en/kibana/current/install.html
We can configure the ELK stack packages in any machine, in this session , we have installed and configured ELK in windows and shipped the HANA logs from our HANA box in cloud to the windows server (ELK).
Step 2: Configure Elasticsearch
Open the elastic search URL and check the cluster name and node are set correctly as per the installation steps

In this example we use the default index which has created , optionally you can create an index in the elastic search .
If you’re running Elasticsearch on Windows, you can download cURL from http://curl.haxx.se/download.html. cURL provides a convenient way to submit requests to Elasticsearch and installing cURL enables you to copy and paste many of the examples in this book to try them out.
We have used “elastic head “ a front end tool visualize the elastic search cluster and indices

Step 4: Configure logstash
The actual configuration file consists of three sections: input, filter and output. The input part defines the logs to read, the filter part defines the filter to be applied to the input and the output part specifies where to write the result to.

The general format looks like

Logstash comes out of the box with everything it takes to read Apache logs, syslog’s. In case of SAP HANA components logs we need to derive custom pattern to read the logs. To do this we have used Grok.
Grok is currently the best way in logstash to parse crappy unstructured log data into something structured and query able. Grok works by combining text patterns into something that matches your logs. Please use the below links to derive the patterns using Grok
https://www.elastic.co/guide/en/logstash/current/plugins-filters-grok.html#plugins-filters-grok-matc...
If you need help building patterns to match your logs, you will find the http://grokdebug.herokuapp.com and http://grokconstructor.appspot.com/ applications quite useful!
Input
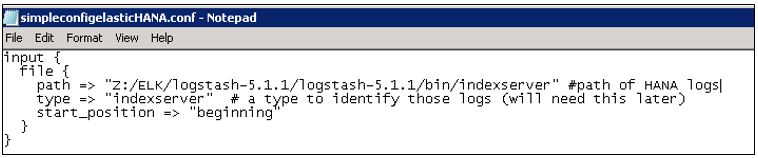
All files starting with “indexserver_” at the directory are being read by logstash. To all lines read a type is added, which can be used later for searching and filtering purposes.
Filter
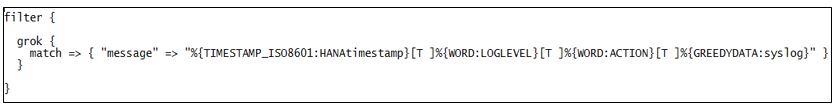
The filter is applied to all lines with type which is mentioned in the input. Grok is doing the regular expressions and to find the customized patterns for HANA logs.To facilitate later analysis we have included timestamp from the log , action and the log message.
Output

As output a local elasticsearch server is defined. The logs are written to the default index . This stores the log lines as a value to elasticsearch and makes it accessible for further processing.
If you don’t want to see the output log , you can comment the “stdout { codec => rebydebug }”
Execute the Logstash with config file
Save the config file in the logtash bin directory and execute the below command to start Logstash

You could notice the working filter as shown below


Similarly, multiple input files can be used to parse and send the JSON to elasticsearch

Sample log files from HANA
Index server input log

[8296]{-1}[-1/-1] 2017-01-04 07:03:58.024596 i TraceContext     TraceContext.cpp(00923) : UserName=

[8296]{-1}[-1/-1] 2017-01-04 07:03:58.024591 i STATS_WORKER     ConfigurableInstaller.cpp(00043) : installing Alert_Server_Time_Discrepancy (id is 76): nothing to do

[8296]{-1}[-1/-1] 2017-01-04 07:03:58.024600 i STATS_WORKER     ConfigurableInstaller.cpp(00030) : installing Alert_Check_Database_Disk_Usage (id is 77)

[8296]{-1}[-1/-1] 2017-01-04 07:03:58.026501 i TraceContext     TraceContext.cpp(00923) : UserName=

[8296]{-1}[-1/-1] 2017-01-04 07:03:58.026497 i STATS_WORKER     ConfigurableInstaller.cpp(00043) : installing Alert_Check_Database_Disk_Usage (id is 77): nothing to do

[8296]{-1}[-1/-1] 2017-01-04 07:03:58.026505 i STATS_WORKER     ConfigurableInstaller.cpp(00030) : installing Alert_Replication_Connection_Closed (id is 78)

Nameserver input log

[5159]{-1}[-1/-1] 2017-01-04 07:03:57.725294 i STATS_CTRL       CallInterfaceProxy.cpp(00044) : sending install request

[5159]{-1}[-1/-1] 2017-01-04 07:03:59.696959 i STATS_CTRL       CallInterfaceProxy.cpp(00048) : response to install request: OK

[5159]{-1}[-1/-1] 2017-01-04 07:03:59.727035 i STATS_CTRL       NameServerControllerThread.cpp(00777) : removing old section from statisticsserver.ini: statisticsserver_general

[5159]{-1}[-1/-1] 2017-01-04 07:03:59.738053 i STATS_CTRL       NameServerControllerThread.cpp(00782) : making sure old StatisticsServer is inactive statisticsserver.ini: statisticsserver_general, active=false

[5159]{-1}[-1/-1] 2017-01-04 07:03:59.747184 i STATS_CTRL       NameServerControllerThread.cpp(00524) : installation done

[5159]{-1}[-1/-1] 2017-01-04 07:03:59.747241 i STATS_CTRL       NameServerControllerThread.cpp(00575) : starting controller

[5159]{-1}[-1/-1] 2017-01-04 07:03:59.747305 i STATS_CTRL       NameServerControllerThread.cpp(00192) : waited 177030ms

Web dispatcher input log

[8341]{-1}[-1/-1] 2017-01-03 15:45:18.980609 i webdispatcher    webdispatcher.cpp(00163) : Waiting for Web Dispatcher Shutdown ...

[8341]{-1}[-1/-1] 2017-01-03 15:45:18.980960 e TNS              TNSClient.cpp(00657) : nameserver vhcalhdbdb:30201 not initialized. retry in 5 sec...

[8341]{-1}[-1/-1] 2017-01-03 15:45:18.980987 i webdispatcher    webdispatcher.cpp(00199) : Notified Nameserver about shutdown

[8341]{-1}[-1/-1] 2017-01-03 15:45:18.980993 i Service_Shutdown TrexService.cpp(00891) : Stopping threads
Step 5: Configure Kibana
Open the Kibana interface and select the index pattern for which index the visualisation need to be created.

In the discover tab we could notice the latest documents , if a time field is configured for the selected index pattern, the distribution of documents over time is displayed in a histogram at the top of the page

Visualize your Elasticsearch data and navigate the Elastic Stack with different chart types.
 Build your own dash board
We can notice that the “Service_Shutdown” has been monitored in the Kibana Dashboard
The cluster and indices can also be monitored in Kibana

Alerting can be done based on the watcher search in Kibana which could send alerts in case of the critical errors , which will be discussed in the blog monitoring and alerting on critical errors of SAP HANA components in real time with Open Stack IT Op....
- SAP Managed Tags:
- SAP HANA,
- SAP HANA, platform edition
- application logs
- elasticsearch
- elk
- ELK stack
- grok
- hana cluster
- hana logs
- hana monitoring
- hana xs engine
- hana xs engine logs
- indexserver log
- it operations
- it operations analytics
- kibana
- logstash
- Monitoring
- nameserver log
- open source
- open stack
- real time dashboard
- real time monitoring
- real time operations
- S4 HANA logs
- sap it operations analytics
- sap system monitoring
- system monitoring
- webdispatcher logs
2 Comments
You must be a registered user to add a comment. If you've already registered, sign in. Otherwise, register and sign in.
Labels in this area
-
"automatische backups"
1 -
"regelmäßige sicherung"
1 -
"TypeScript" "Development" "FeedBack"
1 -
505 Technology Updates 53
1 -
ABAP
14 -
ABAP API
1 -
ABAP CDS Views
2 -
ABAP CDS Views - BW Extraction
1 -
ABAP CDS Views - CDC (Change Data Capture)
1 -
ABAP class
2 -
ABAP Cloud
2 -
ABAP Development
5 -
ABAP in Eclipse
1 -
ABAP Platform Trial
1 -
ABAP Programming
2 -
abap technical
1 -
absl
1 -
access data from SAP Datasphere directly from Snowflake
1 -
Access data from SAP datasphere to Qliksense
1 -
Accrual
1 -
action
1 -
adapter modules
1 -
Addon
1 -
Adobe Document Services
1 -
ADS
1 -
ADS Config
1 -
ADS with ABAP
1 -
ADS with Java
1 -
ADT
2 -
Advance Shipping and Receiving
1 -
Advanced Event Mesh
3 -
AEM
1 -
AI
7 -
AI Launchpad
1 -
AI Projects
1 -
AIML
9 -
Alert in Sap analytical cloud
1 -
Amazon S3
1 -
Analytical Dataset
1 -
Analytical Model
1 -
Analytics
1 -
Analyze Workload Data
1 -
annotations
1 -
API
1 -
API and Integration
3 -
API Call
2 -
Application Architecture
1 -
Application Development
5 -
Application Development for SAP HANA Cloud
3 -
Applications and Business Processes (AP)
1 -
Artificial Intelligence
1 -
Artificial Intelligence (AI)
4 -
Artificial Intelligence (AI) 1 Business Trends 363 Business Trends 8 Digital Transformation with Cloud ERP (DT) 1 Event Information 462 Event Information 15 Expert Insights 114 Expert Insights 76 Life at SAP 418 Life at SAP 1 Product Updates 4
1 -
Artificial Intelligence (AI) blockchain Data & Analytics
1 -
Artificial Intelligence (AI) blockchain Data & Analytics Intelligent Enterprise
1 -
Artificial Intelligence (AI) blockchain Data & Analytics Intelligent Enterprise Oil Gas IoT Exploration Production
1 -
Artificial Intelligence (AI) blockchain Data & Analytics Intelligent Enterprise sustainability responsibility esg social compliance cybersecurity risk
1 -
ASE
1 -
ASR
2 -
ASUG
1 -
Attachments
1 -
Authorisations
1 -
Automating Processes
1 -
Automation
1 -
aws
2 -
Azure
1 -
Azure AI Studio
1 -
B2B Integration
1 -
Backorder Processing
1 -
Backup
1 -
Backup and Recovery
1 -
Backup schedule
1 -
BADI_MATERIAL_CHECK error message
1 -
Bank
1 -
BAS
1 -
basis
2 -
Basis Monitoring & Tcodes with Key notes
2 -
Batch Management
1 -
BDC
1 -
Best Practice
1 -
bitcoin
1 -
Blockchain
3 -
BOP in aATP
1 -
BOP Segments
1 -
BOP Strategies
1 -
BOP Variant
1 -
BPC
1 -
BPC LIVE
1 -
BTP
11 -
BTP Destination
2 -
Business AI
1 -
Business and IT Integration
1 -
Business application stu
1 -
Business Application Studio
1 -
Business Architecture
1 -
Business Communication Services
1 -
Business Continuity
1 -
Business Data Fabric
3 -
Business Partner
12 -
Business Partner Master Data
10 -
Business Technology Platform
2 -
Business Trends
1 -
CA
1 -
calculation view
1 -
CAP
3 -
Capgemini
1 -
CAPM
1 -
Catalyst for Efficiency: Revolutionizing SAP Integration Suite with Artificial Intelligence (AI) and
1 -
CCMS
2 -
CDQ
12 -
CDS
2 -
Cental Finance
1 -
Certificates
1 -
CFL
1 -
Change Management
1 -
chatbot
1 -
chatgpt
3 -
CL_SALV_TABLE
2 -
Class Runner
1 -
Classrunner
1 -
Cloud ALM Monitoring
1 -
Cloud ALM Operations
1 -
cloud connector
1 -
Cloud Extensibility
1 -
Cloud Foundry
4 -
Cloud Integration
6 -
Cloud Platform Integration
2 -
cloudalm
1 -
communication
1 -
Compensation Information Management
1 -
Compensation Management
1 -
Compliance
1 -
Compound Employee API
1 -
Configuration
1 -
Connectors
1 -
Consolidation Extension for SAP Analytics Cloud
1 -
Controller-Service-Repository pattern
1 -
Conversion
1 -
Cosine similarity
1 -
cryptocurrency
1 -
CSI
1 -
ctms
1 -
Custom chatbot
3 -
Custom Destination Service
1 -
custom fields
1 -
Customer Experience
1 -
Customer Journey
1 -
Customizing
1 -
cyber security
2 -
Data
1 -
Data & Analytics
1 -
Data Aging
1 -
Data Analytics
2 -
Data and Analytics (DA)
1 -
Data Archiving
1 -
Data Back-up
1 -
Data Governance
5 -
Data Integration
2 -
Data Quality
12 -
Data Quality Management
12 -
Data Synchronization
1 -
data transfer
1 -
Data Unleashed
1 -
Data Value
8 -
database tables
1 -
Datasphere
2 -
datenbanksicherung
1 -
dba cockpit
1 -
dbacockpit
1 -
Debugging
2 -
Delimiting Pay Components
1 -
Delta Integrations
1 -
Destination
3 -
Destination Service
1 -
Developer extensibility
1 -
Developing with SAP Integration Suite
1 -
Devops
1 -
digital transformation
1 -
Documentation
1 -
Dot Product
1 -
DQM
1 -
dump database
1 -
dump transaction
1 -
e-Invoice
1 -
E4H Conversion
1 -
Eclipse ADT ABAP Development Tools
2 -
edoc
1 -
edocument
1 -
ELA
1 -
Embedded Consolidation
1 -
Embedding
1 -
Embeddings
1 -
Employee Central
1 -
Employee Central Payroll
1 -
Employee Central Time Off
1 -
Employee Information
1 -
Employee Rehires
1 -
Enable Now
1 -
Enable now manager
1 -
endpoint
1 -
Enhancement Request
1 -
Enterprise Architecture
1 -
ETL Business Analytics with SAP Signavio
1 -
Euclidean distance
1 -
Event Dates
1 -
Event Driven Architecture
1 -
Event Mesh
2 -
Event Reason
1 -
EventBasedIntegration
1 -
EWM
1 -
EWM Outbound configuration
1 -
EWM-TM-Integration
1 -
Existing Event Changes
1 -
Expand
1 -
Expert
2 -
Expert Insights
1 -
Fiori
14 -
Fiori Elements
2 -
Fiori SAPUI5
12 -
Flask
1 -
Full Stack
8 -
Funds Management
1 -
General
1 -
Generative AI
1 -
Getting Started
1 -
GitHub
8 -
Grants Management
1 -
groovy
1 -
GTP
1 -
HANA
5 -
HANA Cloud
2 -
Hana Cloud Database Integration
2 -
HANA DB
1 -
HANA XS Advanced
1 -
Historical Events
1 -
home labs
1 -
HowTo
1 -
HR Data Management
1 -
html5
8 -
HTML5 Application
1 -
Identity cards validation
1 -
idm
1 -
Implementation
1 -
input parameter
1 -
instant payments
1 -
Integration
3 -
Integration Advisor
1 -
Integration Architecture
1 -
Integration Center
1 -
Integration Suite
1 -
intelligent enterprise
1 -
Java
1 -
job
1 -
Job Information Changes
1 -
Job-Related Events
1 -
Job_Event_Information
1 -
joule
4 -
Journal Entries
1 -
Just Ask
1 -
Kerberos for ABAP
8 -
Kerberos for JAVA
8 -
Launch Wizard
1 -
learning content
2 -
Life at SAP
1 -
lightning
1 -
Linear Regression SAP HANA Cloud
1 -
local tax regulations
1 -
LP
1 -
Machine Learning
2 -
Marketing
1 -
Master Data
3 -
Master Data Management
14 -
Maxdb
2 -
MDG
1 -
MDGM
1 -
MDM
1 -
Message box.
1 -
Messages on RF Device
1 -
Microservices Architecture
1 -
Microsoft Universal Print
1 -
Middleware Solutions
1 -
Migration
5 -
ML Model Development
1 -
Modeling in SAP HANA Cloud
8 -
Monitoring
3 -
MTA
1 -
Multi-Record Scenarios
1 -
Multiple Event Triggers
1 -
Neo
1 -
New Event Creation
1 -
New Feature
1 -
Newcomer
1 -
NodeJS
2 -
ODATA
2 -
OData APIs
1 -
odatav2
1 -
ODATAV4
1 -
ODBC
1 -
ODBC Connection
1 -
Onpremise
1 -
open source
2 -
OpenAI API
1 -
Oracle
1 -
PaPM
1 -
PaPM Dynamic Data Copy through Writer function
1 -
PaPM Remote Call
1 -
PAS-C01
1 -
Pay Component Management
1 -
PGP
1 -
Pickle
1 -
PLANNING ARCHITECTURE
1 -
Popup in Sap analytical cloud
1 -
PostgrSQL
1 -
POSTMAN
1 -
Process Automation
2 -
Product Updates
4 -
PSM
1 -
Public Cloud
1 -
Python
4 -
Qlik
1 -
Qualtrics
1 -
RAP
3 -
RAP BO
2 -
Record Deletion
1 -
Recovery
1 -
recurring payments
1 -
redeply
1 -
Release
1 -
Remote Consumption Model
1 -
Replication Flows
1 -
research
1 -
Resilience
1 -
REST
1 -
REST API
1 -
Retagging Required
1 -
Risk
1 -
Rolling Kernel Switch
1 -
route
1 -
rules
1 -
S4 HANA
1 -
S4 HANA Cloud
1 -
S4 HANA On-Premise
1 -
S4HANA
3 -
S4HANA_OP_2023
2 -
SAC
10 -
SAC PLANNING
9 -
SAP
4 -
SAP ABAP
1 -
SAP Advanced Event Mesh
1 -
SAP AI Core
8 -
SAP AI Launchpad
8 -
SAP Analytic Cloud Compass
1 -
Sap Analytical Cloud
1 -
SAP Analytics Cloud
4 -
SAP Analytics Cloud for Consolidation
2 -
SAP Analytics Cloud Story
1 -
SAP analytics clouds
1 -
SAP BAS
1 -
SAP Basis
6 -
SAP BODS
1 -
SAP BODS certification.
1 -
SAP BTP
20 -
SAP BTP Build Work Zone
2 -
SAP BTP Cloud Foundry
5 -
SAP BTP Costing
1 -
SAP BTP CTMS
1 -
SAP BTP Innovation
1 -
SAP BTP Migration Tool
1 -
SAP BTP SDK IOS
1 -
SAP Build
11 -
SAP Build App
1 -
SAP Build apps
1 -
SAP Build CodeJam
1 -
SAP Build Process Automation
3 -
SAP Build work zone
10 -
SAP Business Objects Platform
1 -
SAP Business Technology
2 -
SAP Business Technology Platform (XP)
1 -
sap bw
1 -
SAP CAP
2 -
SAP CDC
1 -
SAP CDP
1 -
SAP CDS VIEW
1 -
SAP Certification
1 -
SAP Cloud ALM
4 -
SAP Cloud Application Programming Model
1 -
SAP Cloud Integration for Data Services
1 -
SAP cloud platform
8 -
SAP Companion
1 -
SAP CPI
3 -
SAP CPI (Cloud Platform Integration)
2 -
SAP CPI Discover tab
1 -
sap credential store
1 -
SAP Customer Data Cloud
1 -
SAP Customer Data Platform
1 -
SAP Data Intelligence
1 -
SAP Data Migration in Retail Industry
1 -
SAP Data Services
1 -
SAP DATABASE
1 -
SAP Dataspher to Non SAP BI tools
1 -
SAP Datasphere
9 -
SAP DRC
1 -
SAP EWM
1 -
SAP Fiori
2 -
SAP Fiori App Embedding
1 -
Sap Fiori Extension Project Using BAS
1 -
SAP GRC
1 -
SAP HANA
1 -
SAP HCM (Human Capital Management)
1 -
SAP HR Solutions
1 -
SAP IDM
1 -
SAP Integration Suite
9 -
SAP Integrations
4 -
SAP iRPA
2 -
SAP Learning Class
1 -
SAP Learning Hub
1 -
SAP Odata
2 -
SAP on Azure
1 -
SAP PartnerEdge
1 -
sap partners
1 -
SAP Password Reset
1 -
SAP PO Migration
1 -
SAP Prepackaged Content
1 -
SAP Process Automation
2 -
SAP Process Integration
2 -
SAP Process Orchestration
1 -
SAP S4HANA
2 -
SAP S4HANA Cloud
1 -
SAP S4HANA Cloud for Finance
1 -
SAP S4HANA Cloud private edition
1 -
SAP Sandbox
1 -
SAP STMS
1 -
SAP successfactors
3 -
SAP SuccessFactors HXM Core
1 -
SAP Time
1 -
SAP TM
2 -
SAP Trading Partner Management
1 -
SAP UI5
1 -
SAP Upgrade
1 -
SAP Utilities
1 -
SAP-GUI
8 -
SAP_COM_0276
1 -
SAPBTP
1 -
SAPCPI
1 -
SAPEWM
1 -
sapmentors
1 -
saponaws
2 -
SAPS4HANA
1 -
SAPUI5
4 -
schedule
1 -
Secure Login Client Setup
8 -
security
9 -
Selenium Testing
1 -
SEN
1 -
SEN Manager
1 -
service
1 -
SET_CELL_TYPE
1 -
SET_CELL_TYPE_COLUMN
1 -
SFTP scenario
2 -
Simplex
1 -
Single Sign On
8 -
Singlesource
1 -
SKLearn
1 -
soap
1 -
Software Development
1 -
SOLMAN
1 -
solman 7.2
2 -
Solution Manager
3 -
sp_dumpdb
1 -
sp_dumptrans
1 -
SQL
1 -
sql script
1 -
SSL
8 -
SSO
8 -
Substring function
1 -
SuccessFactors
1 -
SuccessFactors Platform
1 -
SuccessFactors Time Tracking
1 -
Sybase
1 -
system copy method
1 -
System owner
1 -
Table splitting
1 -
Tax Integration
1 -
Technical article
1 -
Technical articles
1 -
Technology Updates
1 -
Technology Updates
1 -
Technology_Updates
1 -
Threats
1 -
Time Collectors
1 -
Time Off
2 -
Time Sheet
1 -
Time Sheet SAP SuccessFactors Time Tracking
1 -
Tips and tricks
2 -
Tools
1 -
Trainings & Certifications
1 -
Transport in SAP BODS
1 -
Transport Management
1 -
TypeScript
2 -
unbind
1 -
Unified Customer Profile
1 -
UPB
1 -
Use of Parameters for Data Copy in PaPM
1 -
User Unlock
1 -
VA02
1 -
Validations
1 -
Vector Database
1 -
Vector Engine
1 -
Visual Studio Code
1 -
VSCode
1 -
Web SDK
1 -
work zone
1 -
workload
1 -
xsa
1 -
XSA Refresh
1
- « Previous
- Next »
Related Content
- Unify your process and task mining insights: How SAP UEM by Knoa integrates with SAP Signavio in Technology Blogs by SAP
- 10+ ways to reshape your SAP landscape with SAP Business Technology Platform – Blog 4 in Technology Blogs by SAP
- Getting ready to start using SAP Focused Run in Technology Blogs by SAP
- What’s New in SAP Analytics Cloud Release 2024.07 in Technology Blogs by SAP
- Integrate C4P-Resource Management with SAP Analytics Cloud or SAP DataSphere in Technology Blogs by SAP
Top kudoed authors
| User | Count |
|---|---|
| 11 | |
| 10 | |
| 7 | |
| 6 | |
| 4 | |
| 4 | |
| 3 | |
| 3 | |
| 3 | |
| 3 |