Step 1: Log on to SPA IBP


Step 2: Open the template which you want to change key figure color.
Step 3: In the template select “Edit View” and click on “View Formats” to enable EMP Formatting Sheet.

Step 4: Click on EMP Formatting Sheet
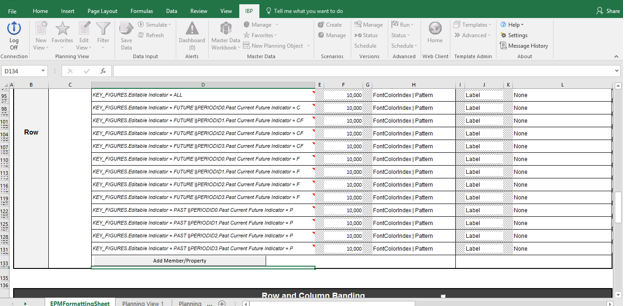
Step 5: Go to Dimension Member/Property Formatting à Row and Click on Add member/Property.

Step 6: In the Member Selection select Key Figures as “Statistical Forecast Qty (0) and click on “Add to multiple selection”. After that go to Multiple Selection Overview and check the member added or not.


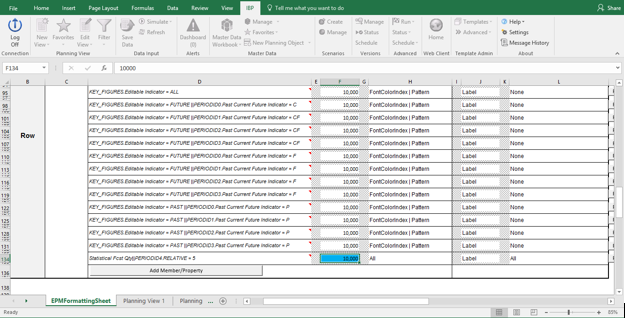
Step 7: Select Property Selection and choose the time dimensions (Day, Week, Month, Quarter, Year). Add the below conditions…
Operator: RELATIVE
Value: =
High Value/Dimension: 5 (From current week to next 5 weeks’ selection highlighted)
Select Add to Multiple Selection and go to Multiple Selection Overview and check the Selection.
Save the selection and review the Add member/ property and change the color code.


Go to Planning View and Refresh. After 5 weeks key figure data highlighted with color.

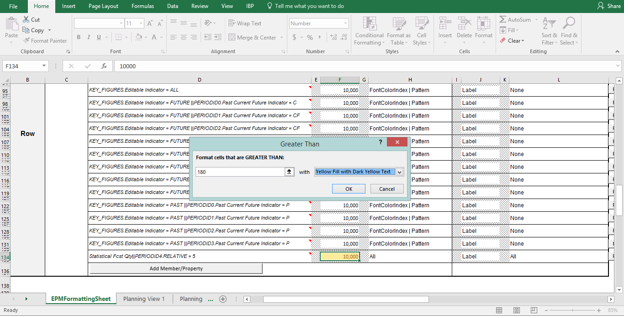
If user wants to add multiple conditions follows as..
Value below 180 = Normal color
Value more than 180 = Yellow color
Go to Excel Home -> Conditional Formatting -> Highlight Cell Rules -> Greater than..and condition/Color.

Go to Planning view and Refresh…condition color applied.

Best Regards,
Lingaiah
