Abstract:
Topic: -
ABAP troubleshooting - Collecting ABAP traces and performance traces using the Single Transaction Analysis tool (ST12)
Speaker – Marco Monteiro, Senior Support Engineer, works in Product Support, Toronto Office, CRM team.
Host: Chris Kernaghan, SAP Mentor
Arranged by William Laverde, SAP Support
Overview: The Single Transaction Analysis tool, ST12, has the ability to collect both ABAP traces and performance traces with an integrated user interface. It offers different methods for tracing and also allows the recording of traces of ABAP transactions, ABAP reports, Webdynpro pages, BSP pages and background jobs.
The traces collected by this tool can be used to investigate code errors and performance problems. This training will show you how to collect and display the traces as well as common problems you may have to deal with while using ST12.
AGENDA:
- Introduction + Overview
- How to collect and display traces of:
- a) Specific user or task
- b) Work process
- c) A transaction or program
- Scheduling traces
- Common issues
- Q&A
Recording: https://sap.na.pgiconnect.com/p2dsr63mpxt/
Notes:
Service Tools for Applications (ST-A/PI)
https://support.sap.com/supporttools
Installation:
69455 - Servicetools for Applications ST-A/PI (ST14, RTCCTOOL, ST12)
How to use:
755977 - ST12 "ABAP Trace for SAP EarlyWatch/GoingLive"
ST12 - collects traces, mix of SE30, ST05
Troubleshooting, program working, consider using ST12
Comes with ST-API

It will help to provide SAP a trace
Not officially supported, no official documentation
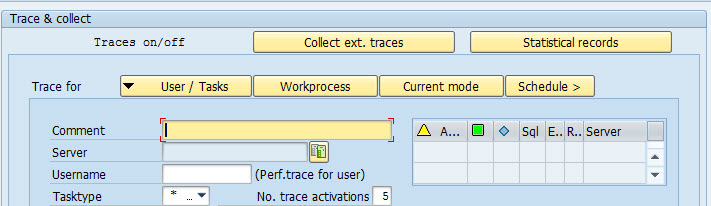
Running the trace

Trace results:

Tip to enter the user name and then select the server - it will show the server the user is connected to

Avoid activating on all servers
Task types:

In the middle:

performance trace - ST05
ABAP trace - SE30
Statistical records - STAD
Internal tables - if selected, will check for read/loop
Size & duration - 2 options; he usually selects the maximum
Context trace - collect across multiple systems
Further options dropdown:

If you trace your own user, it may track ST12 itself, and could be confusing:

Watch the size of the trace and the filters


Trace did not work - yellow arrow

Where to look for performance problems

Show / Hide options

Performance trace - equivalent of ST05

Current mode - only collects for certain units

Schedule trace to run for a job to run later
Question & Answer
Q: The HTTPs trace us for Web dynpro application - does this also work for Floor Plan Manager (FPM)
A: Cannot tell; if it is http and connect to app server, yes
Q: How do i provide these traces to sap in an oss call?
A: Collect traces, open incident, and indicate which trace should be analyzed - this should speed up incident
Q: Is there shortcut for switching the trace on and off? If yes what is it?
A: No
Q: Could this be used for Multi level End to End Scenario e.g. iOS based Fiori App access the Gateway, Gateway access the ERP instance ... I would like to know whether the issue is on Gateway or ERP instant...
A: Yes, backend call is http call for Fiori
In 2017, API's Community Call is planned
