
- SAP Community
- Products and Technology
- Technology
- Technology Blogs by SAP
- Visualizing iPhone Sensor Data with SAP Lumira
Technology Blogs by SAP
Learn how to extend and personalize SAP applications. Follow the SAP technology blog for insights into SAP BTP, ABAP, SAP Analytics Cloud, SAP HANA, and more.
Turn on suggestions
Auto-suggest helps you quickly narrow down your search results by suggesting possible matches as you type.
Showing results for
Employee
Options
- Subscribe to RSS Feed
- Mark as New
- Mark as Read
- Bookmark
- Subscribe
- Printer Friendly Page
- Report Inappropriate Content
11-28-2016
4:02 PM
UPDATE (May 10, 2017)
#1 : The platform has a new name, SAP Cloud Platform (SCP), with new capabilities and enhancements. (see Press Release) So I have made this blog up-to-date.
#2 : With the new version of Message Management Service Cockpit, it has an option to show the Application Data with graph. So I have added some screenshots for that (in Step 2)
The goal of this blog post is to share how I build the live demo thru the story of IoT and analytics with SAP's technologies, SAP Cloud Platform and Lumira. So this blog is considered as an extended use case leveraged from patrick.colucci's post which showing "The Easiest Way to Stream your iPhone’s Sensor Data to SAP Cloud Platform".
This post is also inspired by another blog from anthony.mcleod who built a SAPUI5 dashboard using SAP Web IDE to visualize the streaming sensor data from SensorPhone application. Please check out Anthony McLeod's blog post here.
I usually start telling the story with IoT technology, SensorPhone app is the great example of showing them various types of real-time sensor data including movements of accelerometer and gyroscope, GPS coordinate, altitude and audio level from primary microphone. This is where the demo start by showing SensorPhone app stream the data to SCP.
Once the data is ready on SCP, let's consume this data using SAP Lumira
Before we get started, here is what you will need:
Step 1: Opening a Database Tunnel
A database tunnel is required in order to connect SAP Lumira to SAP HANA database in SCP instance. To open a database tunnel use the "open-db-tunnel" command from the "tools" folder of your SDK installation.
Open the command prompt. Change the current directory to SDK installation folder and then "tools" foler, which contains the neo.bat and neo.sh files.

Execute command: neo open-db-tunnel -i <Instance Name> -a <Account Name> -h <Host Name> -u <Username>
After entering your password, the tunnel will be successfully opened. You will need to keep this window open while connecting your application to HANA database.

Important: The Password will change everytime you open the tunnel. And the tunnel will be automatically closed after 24 hours.
Step 2: Getting your Table Name from HCP IoT Services
Login to SAP Cloud Platform Cockpit, browse into your Internet of Things Services.

In "Message Management" section, click on "Send and view messages, or perform other actions" to go to MMS Cockpit.

In "Core Services" section, click on "Display stored messages".

It will show the list of table. Click on the table name T_IOT_<Message Type>. This will show the data in your table.

Note down your schema name showing in front of .(dot) and your table name showing behind .(dot), this will be required in the next step.

UPDATE (May 10, 2017)
(optional) Noticed in "Message Management" section on "Internet of Things Services Cockpit" screen, you will be able to update to newer version (if available). So go ahead hit the button, then you will be prompted for updating. By providing password and clicking on Deploy button, you will get the latest version of MMS in few minutes.

(optional) After successful deployment, your Internet of Things Services Cockpit looks like this.

(optional) Then you will have an option to display IOT table data in a nice graph view.

Step 3: Connecting your Lumira to IoT Table
Open your SAP Lumira. Click menu "File" > "New".

Select "Query with SQL", click "Next".
In "Add new dataset" dialog, scroll down to SAP section, select SAP HANA database 1.0, click "Next".

Here is where you can copy/paste the "User Name", "Password", "Host Name" and "Instance Number" from database tunnel screen (in Step 1). Then click "Connect"

Browse to your schema name and table name you got from previous step. Then click "Preview" and "Create"

Here we are in the Lumira Visualize room.
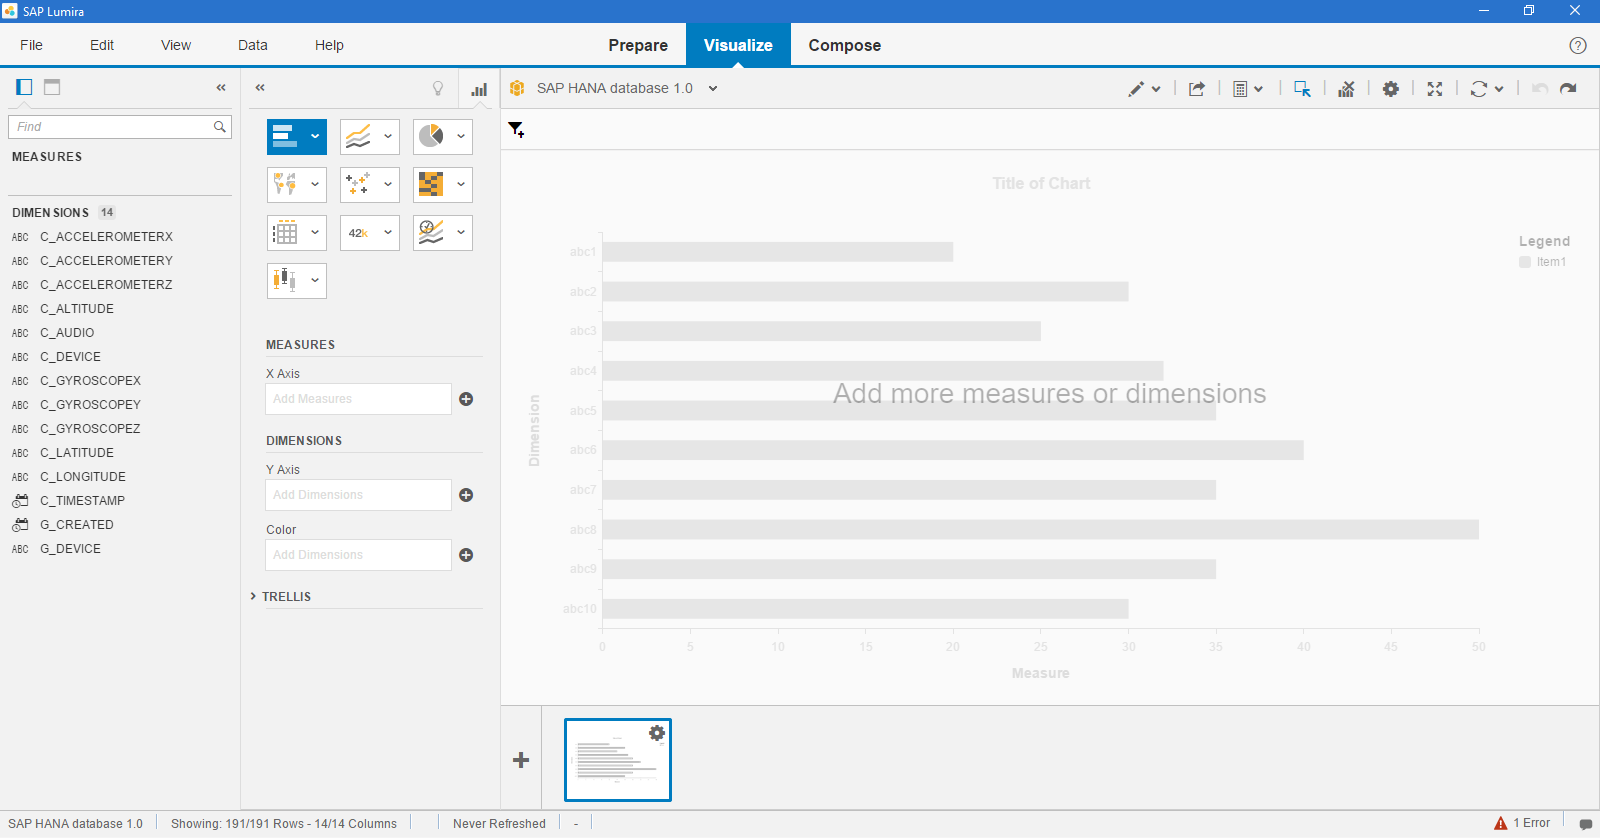
If you are seeing this screen, you have successfully linked Lumira to IoT table. Please note that Lumira acquired Dataset from source connection and stored for your visualization. Meaning, your Dataset will not be automatically updated until next manually refresh (the icon on the top-right on the toolbar.
Step 4: Creating Stories, Personalized Your Own Demonstration.
Here we are at the stage of building up the nice presentation to deliver the message from data by using Lumira's features.
Following is only an example I built for demonstration. Also it is for you to follow if you are not yet familiar with Lumira already. I take the Latitude and Longitude data to plot in ESRI map which is bundled feature in Lumira. This only means to show the location of iPhone where the messages have been sent at the moment of posting.
The data type of Latitude/Longitude data are created as character type. To make use of this, we need to convert them into number data type. Click on the "gear" icon at "C_LATITUDE" column, and select "Convert To Number". (In this example, I change the name of converted column to "N_Latitude")

You will need to do this on C_LONGITUDE column in the same way.
Next I create the geographic hierarchy by using the previous columns of latitude and longitude data. In my case, I created this hierarchy on top of G_DEVICE as a target dimension. This column contains IoT device ID. Click on the "gear" icon at "G_DEVICE" column, select "Create a geographic hierarchy" then "By Latitude / Longitude".

The dialog Geographical Data come up, select Latitude and Longitude from drop-down list. Choose the particular columns. Click "Next" and "Finish"


I simply choose G_DEVICE column again for measurement. I create a measure based on this column. The result of this will be Count(All) column in MEASURES section. There I change the measure name to "SendingCount", just to make it easier to understand.

Next, I add the Geographic Charts, select the "Geo Map" type. This is where ESRI map will be loaded onto your Visualize room. (You will need internet access to do this). Then drag and drop Geographic dimension column we created into "Geo Dimension" box.
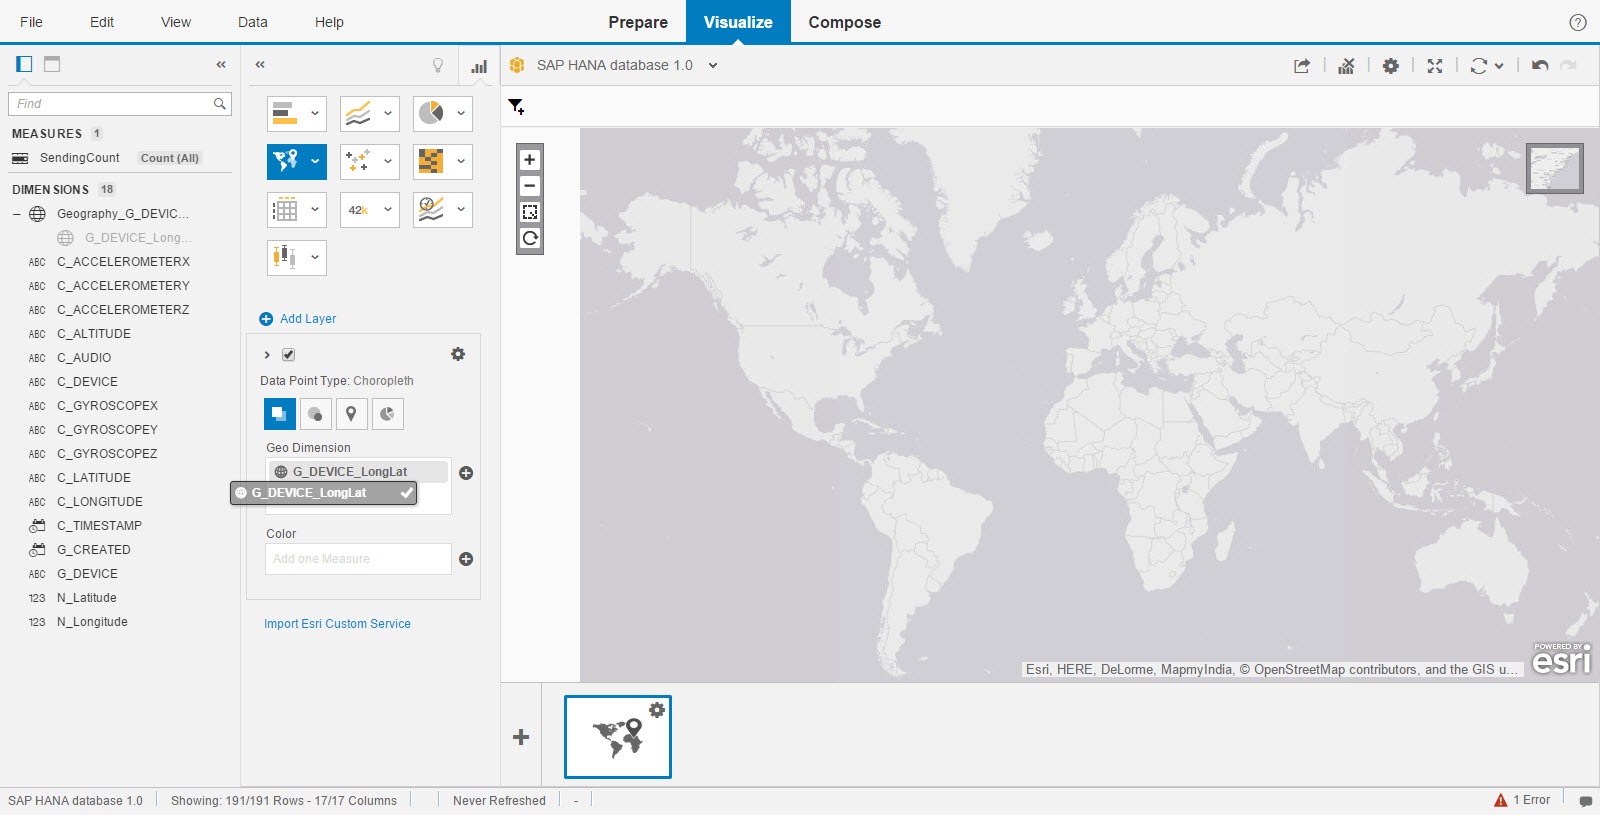
Let's pick the bubble chart, then drag and drop the "SendingCount" measure into "Size" box.


The data will show on map based on location you sent the data from SensorPhone app from iPhone.
And here I make it more interesting chart by drag and drop "C_ALTITUDE" dimension into "Color" box.

Now it is time to make you own stories. Create more charts ! I have actually done other charts showing Audio Level, and Altitude data in Bar charts. But that would not be so complicated. So I leave that for you to try out.

Final Thoughts
So this is an alternative illustration to leverage SAP Cloud Platform by connecting from desktop tool, SAP Lumira. As an on-premise solution, By using database tunnel, it is allowing you to direct access to the cloud schema. I do really hope this is useful and gives you an idea of expand the demonstration to particular use cases further.
Mac, Aphirat C.
Product Specialist, Platform Solutions
SAP (Thailand) Ltd
#1 : The platform has a new name, SAP Cloud Platform (SCP), with new capabilities and enhancements. (see Press Release) So I have made this blog up-to-date.
#2 : With the new version of Message Management Service Cockpit, it has an option to show the Application Data with graph. So I have added some screenshots for that (in Step 2)
The goal of this blog post is to share how I build the live demo thru the story of IoT and analytics with SAP's technologies, SAP Cloud Platform and Lumira. So this blog is considered as an extended use case leveraged from patrick.colucci's post which showing "The Easiest Way to Stream your iPhone’s Sensor Data to SAP Cloud Platform".
This post is also inspired by another blog from anthony.mcleod who built a SAPUI5 dashboard using SAP Web IDE to visualize the streaming sensor data from SensorPhone application. Please check out Anthony McLeod's blog post here.
I usually start telling the story with IoT technology, SensorPhone app is the great example of showing them various types of real-time sensor data including movements of accelerometer and gyroscope, GPS coordinate, altitude and audio level from primary microphone. This is where the demo start by showing SensorPhone app stream the data to SCP.
Once the data is ready on SCP, let's consume this data using SAP Lumira
Before we get started, here is what you will need:
- iPhone with the SensorPhone application installed (version 1.3.2 or higher)
- SAP Cloud Platform account (follow this LINK for free trial account)
- Configured and completed setup of IoT Service as outlined in this POST.
- SAP Cloud Platform SDK (Download and install the latest version from this LINK) Any versions would work, I am using "Java EE 6 Web Profile" SDK version 2.98.6 as of the time of writing this post.
- SAP Lumira installed (Mine is version 1.30 as of the time of writing this post.)
Step 1: Opening a Database Tunnel
A database tunnel is required in order to connect SAP Lumira to SAP HANA database in SCP instance. To open a database tunnel use the "open-db-tunnel" command from the "tools" folder of your SDK installation.
Open the command prompt. Change the current directory to SDK installation folder and then "tools" foler, which contains the neo.bat and neo.sh files.
Execute command: neo open-db-tunnel -i <Instance Name> -a <Account Name> -h <Host Name> -u <Username>
After entering your password, the tunnel will be successfully opened. You will need to keep this window open while connecting your application to HANA database.
Important: The Password will change everytime you open the tunnel. And the tunnel will be automatically closed after 24 hours.
Step 2: Getting your Table Name from HCP IoT Services
Login to SAP Cloud Platform Cockpit, browse into your Internet of Things Services.
In "Message Management" section, click on "Send and view messages, or perform other actions" to go to MMS Cockpit.
In "Core Services" section, click on "Display stored messages".
It will show the list of table. Click on the table name T_IOT_<Message Type>. This will show the data in your table.
Note down your schema name showing in front of .(dot) and your table name showing behind .(dot), this will be required in the next step.
UPDATE (May 10, 2017)
(optional) Noticed in "Message Management" section on "Internet of Things Services Cockpit" screen, you will be able to update to newer version (if available). So go ahead hit the button, then you will be prompted for updating. By providing password and clicking on Deploy button, you will get the latest version of MMS in few minutes.
(optional) After successful deployment, your Internet of Things Services Cockpit looks like this.
(optional) Then you will have an option to display IOT table data in a nice graph view.
Step 3: Connecting your Lumira to IoT Table
Open your SAP Lumira. Click menu "File" > "New".
Select "Query with SQL", click "Next".
In "Add new dataset" dialog, scroll down to SAP section, select SAP HANA database 1.0, click "Next".
Here is where you can copy/paste the "User Name", "Password", "Host Name" and "Instance Number" from database tunnel screen (in Step 1). Then click "Connect"
Browse to your schema name and table name you got from previous step. Then click "Preview" and "Create"
Here we are in the Lumira Visualize room.
If you are seeing this screen, you have successfully linked Lumira to IoT table. Please note that Lumira acquired Dataset from source connection and stored for your visualization. Meaning, your Dataset will not be automatically updated until next manually refresh (the icon on the top-right on the toolbar.
Step 4: Creating Stories, Personalized Your Own Demonstration.
Here we are at the stage of building up the nice presentation to deliver the message from data by using Lumira's features.
Following is only an example I built for demonstration. Also it is for you to follow if you are not yet familiar with Lumira already. I take the Latitude and Longitude data to plot in ESRI map which is bundled feature in Lumira. This only means to show the location of iPhone where the messages have been sent at the moment of posting.
The data type of Latitude/Longitude data are created as character type. To make use of this, we need to convert them into number data type. Click on the "gear" icon at "C_LATITUDE" column, and select "Convert To Number". (In this example, I change the name of converted column to "N_Latitude")
You will need to do this on C_LONGITUDE column in the same way.
Next I create the geographic hierarchy by using the previous columns of latitude and longitude data. In my case, I created this hierarchy on top of G_DEVICE as a target dimension. This column contains IoT device ID. Click on the "gear" icon at "G_DEVICE" column, select "Create a geographic hierarchy" then "By Latitude / Longitude".
The dialog Geographical Data come up, select Latitude and Longitude from drop-down list. Choose the particular columns. Click "Next" and "Finish"
I simply choose G_DEVICE column again for measurement. I create a measure based on this column. The result of this will be Count(All) column in MEASURES section. There I change the measure name to "SendingCount", just to make it easier to understand.
Next, I add the Geographic Charts, select the "Geo Map" type. This is where ESRI map will be loaded onto your Visualize room. (You will need internet access to do this). Then drag and drop Geographic dimension column we created into "Geo Dimension" box.
Let's pick the bubble chart, then drag and drop the "SendingCount" measure into "Size" box.
The data will show on map based on location you sent the data from SensorPhone app from iPhone.
And here I make it more interesting chart by drag and drop "C_ALTITUDE" dimension into "Color" box.
Now it is time to make you own stories. Create more charts ! I have actually done other charts showing Audio Level, and Altitude data in Bar charts. But that would not be so complicated. So I leave that for you to try out.
Final Thoughts
So this is an alternative illustration to leverage SAP Cloud Platform by connecting from desktop tool, SAP Lumira. As an on-premise solution, By using database tunnel, it is allowing you to direct access to the cloud schema. I do really hope this is useful and gives you an idea of expand the demonstration to particular use cases further.
Mac, Aphirat C.
Product Specialist, Platform Solutions
SAP (Thailand) Ltd
- SAP Managed Tags:
- SAP Lumira,
- SAP Business Technology Platform
- appstore
- Cloud
- Community
- data
- emerging technologies
- enterprise mobile
- geo map
- HANA
- hanacloudplatform
- hcp
- hcpfree
- hcpiot
- innovation
- Internet of Things
- internetofthings
- iOS
- iot
- iotconnector
- iotdemo
- iotmms
- iotservice
- iotstarterkit
- ipad
- iphone
- lumira
- marketing
- Mobile
- mobility
- SAP
- sap business trends
- sap hana
- SAPUI5
- send
- sensor
- sensorphone
- smartphone
8 Comments
You must be a registered user to add a comment. If you've already registered, sign in. Otherwise, register and sign in.
Labels in this area
-
ABAP CDS Views - CDC (Change Data Capture)
2 -
AI
1 -
Analyze Workload Data
1 -
BTP
1 -
Business and IT Integration
2 -
Business application stu
1 -
Business Technology Platform
1 -
Business Trends
1,658 -
Business Trends
91 -
CAP
1 -
cf
1 -
Cloud Foundry
1 -
Confluent
1 -
Customer COE Basics and Fundamentals
1 -
Customer COE Latest and Greatest
3 -
Customer Data Browser app
1 -
Data Analysis Tool
1 -
data migration
1 -
data transfer
1 -
Datasphere
2 -
Event Information
1,400 -
Event Information
66 -
Expert
1 -
Expert Insights
177 -
Expert Insights
293 -
General
1 -
Google cloud
1 -
Google Next'24
1 -
Kafka
1 -
Life at SAP
780 -
Life at SAP
12 -
Migrate your Data App
1 -
MTA
1 -
Network Performance Analysis
1 -
NodeJS
1 -
PDF
1 -
POC
1 -
Product Updates
4,577 -
Product Updates
340 -
Replication Flow
1 -
RisewithSAP
1 -
SAP BTP
1 -
SAP BTP Cloud Foundry
1 -
SAP Cloud ALM
1 -
SAP Cloud Application Programming Model
1 -
SAP Datasphere
2 -
SAP S4HANA Cloud
1 -
SAP S4HANA Migration Cockpit
1 -
Technology Updates
6,873 -
Technology Updates
417 -
Workload Fluctuations
1
Related Content
- Unveiling SAP BusinessObjects BI 4.3 SP04 ! in Technology Blogs by SAP
- AI-powered Pipeline Corrosion Analysis: Introduction & Architecture in Technology Blogs by SAP
- All-In-One Travel App with AppGyver – SAP No Code Challenge in Technology Blogs by Members
- E2E Testing Part 6: SAP Analytics Cloud / SAP Lumira in Technology Blogs by Members
- An S/4HANA Extended Warehouse Management (EWM) powered Lego Warehouse with SAP Cloud Platform in Technology Blogs by Members
Top kudoed authors
| User | Count |
|---|---|
| 33 | |
| 25 | |
| 10 | |
| 7 | |
| 7 | |
| 7 | |
| 6 | |
| 6 | |
| 5 | |
| 4 |