
- SAP Community
- Products and Technology
- Technology
- Technology Blogs by SAP
- A Focused Solution for SAP Solution Manager: Dashb...
Technology Blogs by SAP
Learn how to extend and personalize SAP applications. Follow the SAP technology blog for insights into SAP BTP, ABAP, SAP Analytics Cloud, SAP HANA, and more.
Turn on suggestions
Auto-suggest helps you quickly narrow down your search results by suggesting possible matches as you type.
Showing results for
Former Member
Options
- Subscribe to RSS Feed
- Mark as New
- Mark as Read
- Bookmark
- Subscribe
- Printer Friendly Page
- Report Inappropriate Content
11-25-2016
4:19 PM
Why do we need a Dashboard Factory?
Dashboard Factory is the solution for the above questions.
What are the Objectives?
Approach
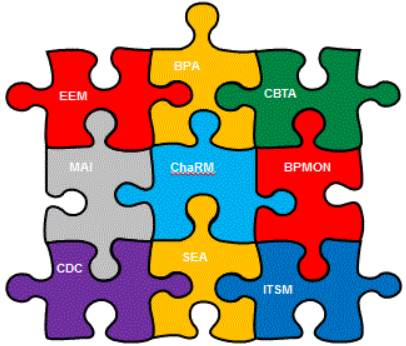
The Dashboard Factory aggregates and correlates all SAP Solution Manager Metrics in Single Comprehensive views.

Step 1: Define your objective
Define your objective;
Execution
Control
Transparency
Step 2: Define your Dashboard Strategy
Define your Dashboard Strategy;
Delivery Methodology

Focused Solutions – Current Portfolio and Planning

Dashboard Factory Add On
The Dashboard Factory is delivered as an external Add-on for MaxAttention Services.
Add-on (ST-OST)
 Focused Solutions Service for Dashboards
The objectives of the Focused Solution Service for Dashboards is to enable your organization in creating, configuring, maintaining your own dashboards.
The Starter package provides you with the ST-OST add-on delivery/configuration and the empowering on the usage of the Dashboards.
The Premium package is used to align your dashboard objectives together with the Dashboard Factory functionalities and your ALM//RunSAP roadmap.
http://service.sap.com/sap/support/notes/2080080
https://support.sap.com/solution-manager/training-services.html

General Information
Pre-requisites / Preparation
Full pre-requisites and delivery methodology are described in SAP Notes 2080080.
Minimum mandatory version of SAP Solution Manager is SP13.
The service preparation includes:
ST-OST add-on installation
ST-OST add-on activation
Release
The DF is released in the ST-OST package SP2.
ST-OST SP1: 20th April /2015
ST-OST SP2: 9th November 2015
Deliverables
In addition to the configuration of dashboard instances in your environment, this dashboard Factory services summarizes the results in an service report documentation.
For more information refer;
http://service.sap.com/sap/support/notes/2080080
DF Navigation MAP (Data Flow)

Data Models: Operational Dashboards
The OCC Operation Dashboard gives full transparency of all alerts defined in the Alert Catalog with their current status as well as the corresponding incidents.
It offers link to the different tools and components used to follow the Service Operation Procedures of the OCC.
Multiple instances of the same dashboard could be distributed to different teams of OCC Operators.

Data Models: Service Level Dashboard
Its objective is to provide customers with Service Level compliancy reporting capabilities.
Transparency on IT Processes based on selected specific set of KPIs and periods.
Service Level Dashboard Yesterday;

Data Models: Tactical Dashboards
The Tactical Dashboards for SAP Applications allows customers to report the status of a selected list of systems based on a pre-defined set of KPIs configured with specifics thresholds
In addition it gives trend analysis, historical view for the following scenarios:

The SAP Application Management Dashboard sets baseline on the following SAP performance metrics:
Data Models: Strategic Dashboard
The Strategic Dashboard gives to IT department the capabilities to demonstrate the value of their services to their customers. It allows customers to associate pre-defined indicators to specific targets and aggregate them into KPIs. (ex: OCC Value Realization Dashboard)

Delivery Model
During the Dashboard Factory services, AGS consultants ensures that the Solution Manager scenarios are included in the ALM/RunSAP roadmap of the customers.
Standard content
OCC Dashboard Center
The goal of OCC Dashboard Center is to simplify data visualization and make Solution Manager data accessible everywhere.

Dashboard Features

Create/Edit a Dashboard with Gadgets

Authorization control
üYou may want to restrict access to dashboard,
üExample: allow only a few users to edit the dashboards etc.
In the dashboard program there are three groups of users for different responsibilities:
ADMIN: setup providers, mass maintenance of dashboards, change configurations, assign user groups
EDITOR: edit dashboards
VIEWER: view dashboard
In addition an ADMIN can set a dashboard to READONLY to prevent further changes from EDITOR.
To assign users or set read only flag

Anonymous Access
You may want to provide anonymous access URL to the dashboard. For example to distribute the dashboard to large group of end-users and allow them review the dashboards on iphone/ipads.
Create user ‘DASHBOARD’ with following roles
- Are you a victim of missing control over your KPIs?
- Are you missing full visibility of system operation?
- Are you unable to centrally control system instability?
- Do you have full control on your SAP applications life-cycle?
- Are you facing High Operating and Application Management Cost?
- Are you facing High Unused Optimization Potential?
- Do you need a tool tailored to your specific operational needs?
Dashboard Factory is the solution for the above questions.
What are the Objectives?
- Simple, but Powerful and Flexible
- No Programming
- Dashboards in Minutes
- Trends and Statuses
- Any Metrics
- For both IT and the Business
- Device Agnostic
Approach
The Dashboard Factory aggregates and correlates all SAP Solution Manager Metrics in Single Comprehensive views.
Step 1: Define your objective
Define your objective;
Execution
- Align IT strategies and organizational goals
- Make more informed decisions
Control
- Measure efficiencies/ inefficiencies
- Identify and correct negative trends
Transparency
- Gain total visibility of all Solutions instantly
- Visually present performance measures
Step 2: Define your Dashboard Strategy
Define your Dashboard Strategy;
- Strategic Dashboard
- Tactical Dashboard
- Service Level Dashboard
- Operational Dashboard
- OCC Dashboard
- SAP Application Performance
Delivery Methodology
Focused Solutions – Current Portfolio and Planning
Dashboard Factory Add On
The Dashboard Factory is delivered as an external Add-on for MaxAttention Services.
Add-on (ST-OST)
- Content supporting aggregation, unification and correlation of multiple sources based on all Solution Manager scenarios and areas: RunSAP, ALM.
- Simple Customization for UI and Content based on Dashboards Models.
- Extension model based on pre-defined API.
Focused Solutions Service for DashboardsThe objectives of the Focused Solution Service for Dashboards is to enable your organization in creating, configuring, maintaining your own dashboards.
The Starter package provides you with the ST-OST add-on delivery/configuration and the empowering on the usage of the Dashboards.
The Premium package is used to align your dashboard objectives together with the Dashboard Factory functionalities and your ALM//RunSAP roadmap.
http://service.sap.com/sap/support/notes/2080080
https://support.sap.com/solution-manager/training-services.html
General Information
Pre-requisites / Preparation
Full pre-requisites and delivery methodology are described in SAP Notes 2080080.
Minimum mandatory version of SAP Solution Manager is SP13.
The service preparation includes:
ST-OST add-on installation
ST-OST add-on activation
Release
The DF is released in the ST-OST package SP2.
ST-OST SP1: 20th April /2015
ST-OST SP2: 9th November 2015
Deliverables
In addition to the configuration of dashboard instances in your environment, this dashboard Factory services summarizes the results in an service report documentation.
For more information refer;
http://service.sap.com/sap/support/notes/2080080
DF Navigation MAP (Data Flow)
Data Models: Operational Dashboards
The OCC Operation Dashboard gives full transparency of all alerts defined in the Alert Catalog with their current status as well as the corresponding incidents.
It offers link to the different tools and components used to follow the Service Operation Procedures of the OCC.
Multiple instances of the same dashboard could be distributed to different teams of OCC Operators.
Data Models: Service Level Dashboard
Its objective is to provide customers with Service Level compliancy reporting capabilities.
Transparency on IT Processes based on selected specific set of KPIs and periods.
Service Level Dashboard Yesterday;
Data Models: Tactical Dashboards
The Tactical Dashboards for SAP Applications allows customers to report the status of a selected list of systems based on a pre-defined set of KPIs configured with specifics thresholds
In addition it gives trend analysis, historical view for the following scenarios:
- Performance
- TOP transactions
- Database
- Hardware Resources
- User Load
- Security
- Maintenance
- Availability
The SAP Application Management Dashboard sets baseline on the following SAP performance metrics:
- End-User Experience: performance and availability experienced by end users of the application.
- Business Process: Throughput and backlog of Business Transactions
- System monitoring: Resources used by the application
- Interface & Connection: Performance and availability of system interfaces
- Jobs: performance and errors (delay, abnormal termination) of batch jobs execution
- Transaction: volume, load and response time of transactions processed by the application.
- Availability: Application’s Resources availability including hosts, DB, Application Servers.
Data Models: Strategic Dashboard
The Strategic Dashboard gives to IT department the capabilities to demonstrate the value of their services to their customers. It allows customers to associate pre-defined indicators to specific targets and aggregate them into KPIs. (ex: OCC Value Realization Dashboard)
Delivery Model
During the Dashboard Factory services, AGS consultants ensures that the Solution Manager scenarios are included in the ALM/RunSAP roadmap of the customers.
Standard content
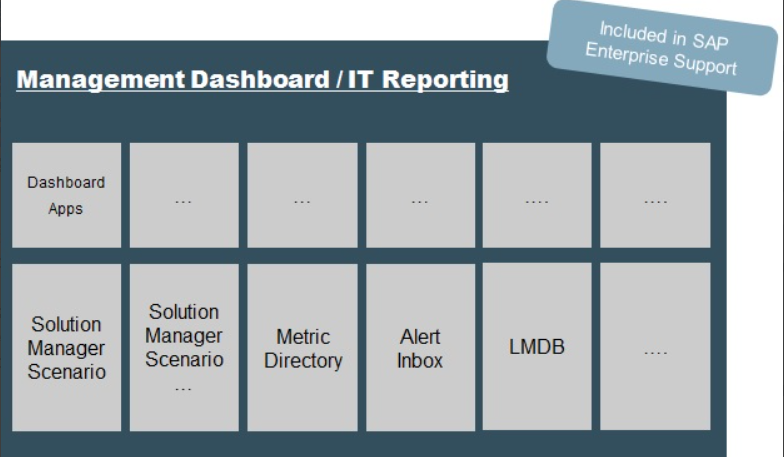
- Management Dashboards Apps providing current status and major issues of your IT department in near real-time for single Solution Manager scenario.
- Support you in identifying and correcting negative trends.
- Enable you to take informed decisions, Minimize system administration efforts, reducing TCO.
OCC Dashboard Center
The goal of OCC Dashboard Center is to simplify data visualization and make Solution Manager data accessible everywhere.
- Data can be from multiple source including ALM.
- Generates UI5 charts to feed latest browsers and mobile devices.
Dashboard Features
Create/Edit a Dashboard with Gadgets
Authorization control
üYou may want to restrict access to dashboard,
üExample: allow only a few users to edit the dashboards etc.
In the dashboard program there are three groups of users for different responsibilities:
ADMIN: setup providers, mass maintenance of dashboards, change configurations, assign user groups
EDITOR: edit dashboards
VIEWER: view dashboard
In addition an ADMIN can set a dashboard to READONLY to prevent further changes from EDITOR.
To assign users or set read only flag
Anonymous Access
You may want to provide anonymous access URL to the dashboard. For example to distribute the dashboard to large group of end-users and allow them review the dashboards on iphone/ipads.
Create user ‘DASHBOARD’ with following roles
- SAP_SMWORK_TECH_MON
- SAP_NOTIF_ADMIN
- SAP_SM_EEM_LEVEl01
- SAP_SYSTEM_REPOSITORY_DIS
- SAP Managed Tags:
- SAP Fiori
You must be a registered user to add a comment. If you've already registered, sign in. Otherwise, register and sign in.
Labels in this area
-
ABAP CDS Views - CDC (Change Data Capture)
2 -
AI
1 -
Analyze Workload Data
1 -
BTP
1 -
Business and IT Integration
2 -
Business application stu
1 -
Business Technology Platform
1 -
Business Trends
1,658 -
Business Trends
91 -
CAP
1 -
cf
1 -
Cloud Foundry
1 -
Confluent
1 -
Customer COE Basics and Fundamentals
1 -
Customer COE Latest and Greatest
3 -
Customer Data Browser app
1 -
Data Analysis Tool
1 -
data migration
1 -
data transfer
1 -
Datasphere
2 -
Event Information
1,400 -
Event Information
66 -
Expert
1 -
Expert Insights
177 -
Expert Insights
293 -
General
1 -
Google cloud
1 -
Google Next'24
1 -
Kafka
1 -
Life at SAP
780 -
Life at SAP
12 -
Migrate your Data App
1 -
MTA
1 -
Network Performance Analysis
1 -
NodeJS
1 -
PDF
1 -
POC
1 -
Product Updates
4,577 -
Product Updates
340 -
Replication Flow
1 -
RisewithSAP
1 -
SAP BTP
1 -
SAP BTP Cloud Foundry
1 -
SAP Cloud ALM
1 -
SAP Cloud Application Programming Model
1 -
SAP Datasphere
2 -
SAP S4HANA Cloud
1 -
SAP S4HANA Migration Cockpit
1 -
Technology Updates
6,873 -
Technology Updates
416 -
Workload Fluctuations
1
Related Content
- Synchronization of newly added fields to existing DQM rules in SAP Master data Quality solution in Technology Q&A
- Onboarding Users in SAP Quality Issue Resolution in Technology Blogs by SAP
- How to host static webpages through SAP CPI-Iflow in Technology Blogs by Members
- How to use AI services to translate Picklists in SAP SuccessFactors - An example in Technology Blogs by SAP
- How to send email in SAP S/4 HANA Cloud public on creation of Purchase order to approve in Technology Q&A
Top kudoed authors
| User | Count |
|---|---|
| 31 | |
| 24 | |
| 8 | |
| 7 | |
| 7 | |
| 6 | |
| 6 | |
| 5 | |
| 5 | |
| 4 |