

- SAP Community
- Products and Technology
- Technology
- Technology Blogs by SAP
- What’s New in SAP BusinessObjects Cloud and SAP Di...
Technology Blogs by SAP
Learn how to extend and personalize SAP applications. Follow the SAP technology blog for insights into SAP BTP, ABAP, SAP Analytics Cloud, SAP HANA, and more.
Turn on suggestions
Auto-suggest helps you quickly narrow down your search results by suggesting possible matches as you type.
Showing results for
cchoy
Participant
Options
- Subscribe to RSS Feed
- Mark as New
- Mark as Read
- Bookmark
- Subscribe
- Printer Friendly Page
- Report Inappropriate Content
11-05-2016
6:40 AM
This blog covers some of the latest new features and enhancements coming soon in SAP BusinessObjects Cloud and SAP Digital Boardroom release 2016.21. Please refer to the release notes for more details.
Highlights of this release include:
We’ve redesigned our home screen to help you get started quickly in SAP BusinessObjects Cloud.

Our new and improved guided tips are a great way to discover and learn about key areas of SAP BusinessObjects Cloud.
You can now use Internet Explorer 11 to view stories, events, files, and for collaborating with other users.
With this release, you have the ability to assign start and due dates for all of your events. This is particularly useful in our new Gantt view, which is a bar chart view that helps you see how your events and tasks relate to each other.

We now support the JDBC drivers for IBM Puredata (Netezza) Service 7 and Oracle 11.

When you’re creating dimensions, you can now define some as public if you want them to be reusable in other models.

Save time creating a new model by copying an existing one.

We’ve simplified the story designer panel to make it less cluttered and easier for you to get to the options you need. The designer panel now only has two parts: Builder and Styling.
You can quickly get to various tools and customization options, like linked analysis and conditional formatting, through the + within the designer panel or through the quick action menu.
Creating a story is now easier than ever. Now you have the option to select from our library of built-in templates, which creates placeholder widgets on a story. Just add or drag a chart into one of the placeholders for it to snap into place.
Working on a smaller resolution browser? You can maximize your workspace by collapsing your toolbar. This is a user-specific setting that the application will remember the next time you log in.

In this release, we have several new enhancements for Explorer:

Add a dynamic or fixed error range to a bar chart, and customize it the way you want with regard to color, width, labels, and tooltips.


Cell locking is a feature that allows you to fix the value of individual cells in a table so that they are not updated with aggregation. In this release, we’ve extended this capability so that you can lock table cells when you’re working with restricted measures.

There are a few enhancements for working with currencies in tables:

Our new Build Your Discovery panel allows you to quickly configure a machine discovery to see how underlying variables are influencing a given dimension or measure. You can use this panel to select a target analysis column and classification groups (e.g. baseline, comparison).

Can’t get to a triple touchscreen display? We’ve optimized the SAP Digital Boardroom so that you can view it more easily on a single-screen device like a laptop.
Initially when you launch the Digital Boardroom, you will start with the Agenda. When you click to view an agenda item on a single-screen device, you will see that the selected item is displayed prominently but the other two “screens” are accessible via small thumbnails on the side. You can even temporarily maximize the selected item so that it fills the screen.

Highlights of this release include:
- Home screen updates and new sample story to get you up and running faster
- Internet Explorer 11 support for viewing of analytic content
- The ability to copy models, and define dimensions as public or private
- A redesigned designer panel for stories
- The ability to create a story from a template
- Various enhancements in Explorer
- Various enhancements for working with currencies in tables
- A new Build Your Discovery panel for machine discoveries
- An optimized view of Digital Boardroom for single-screen devices
Core Improvements
Home screen updates
We’ve redesigned our home screen to help you get started quickly in SAP BusinessObjects Cloud.
- Try exploring our sample story to see some of our key features in action.
- Pinning to the home screen is the quickest way to get to your most frequently accessed content. We’ve included a couple of pins from the sample story to show you what that could look like.
- Quickly access your most recent content in the “Recent Stories” tile.
- Learn how to customize your home screen
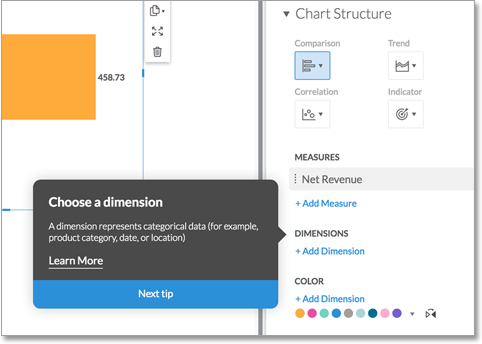
Discover the application with guided tips
Our new and improved guided tips are a great way to discover and learn about key areas of SAP BusinessObjects Cloud.
- Tips are now sequenced based on the workflow, to help you focus on one task at a time.
- Tips are on by default, but won’t show up again once you’ve seen them the first time. They can be reset if you would like to see them again.
Internet Explorer 11 support for viewing of analytic content
You can now use Internet Explorer 11 to view stories, events, files, and for collaborating with other users.
Gantt view for events
With this release, you have the ability to assign start and due dates for all of your events. This is particularly useful in our new Gantt view, which is a bar chart view that helps you see how your events and tasks relate to each other.
Core: Data Integration
Oracle and Netezza JDBC driver support
We now support the JDBC drivers for IBM Puredata (Netezza) Service 7 and Oracle 11.
- See the System Requirements and Technical Prerequisites page for the full list of supported JDBC databases
- Learn how to create a connection that allows you to import data from an SQL database
Core: Modeling
Define dimensions as public or private
When you’re creating dimensions, you can now define some as public if you want them to be reusable in other models.
- Public dimensions are not saved with the model. Instead, they can be referenced by multiple models, and for this reason they require a global unique name. Public dimensions are displayed with a globe icon (see below).
- Private dimensions exist only in the current model, so they are also deleted when you delete the model.
- Learn more about public and private dimensions
Copying models
Save time creating a new model by copying an existing one.
- Private dimensions are copied along with the model, while public dimensions are referenced from the copied model.
- Please note only models created in SAP BusinessObjects Cloud version 2016.21 and later, and without pool dimensions, can be copied.
- Learn how to copy models
Core: Data Analysis, Stories, and Tables
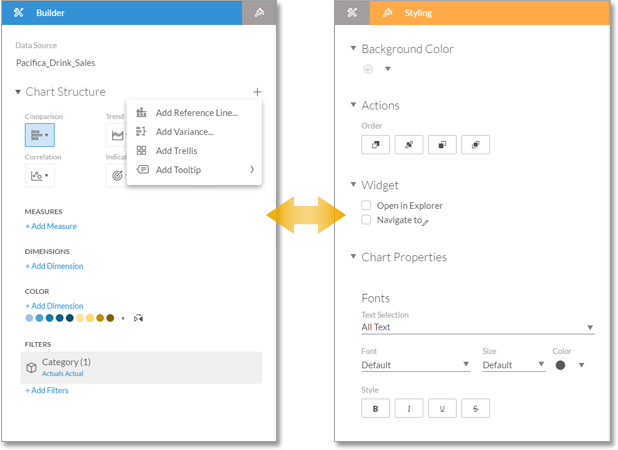
A redesigned designer panel
We’ve simplified the story designer panel to make it less cluttered and easier for you to get to the options you need. The designer panel now only has two parts: Builder and Styling.
You can quickly get to various tools and customization options, like linked analysis and conditional formatting, through the + within the designer panel or through the quick action menu.
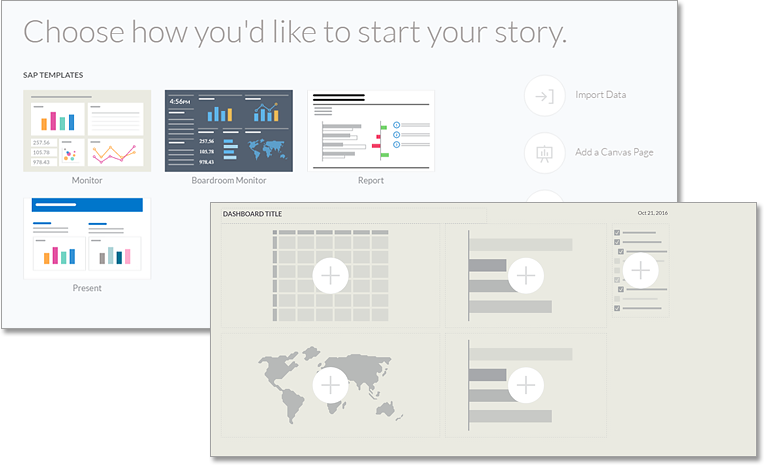
Start your story from a template
Creating a story is now easier than ever. Now you have the option to select from our library of built-in templates, which creates placeholder widgets on a story. Just add or drag a chart into one of the placeholders for it to snap into place.
Collapse your story toolbar
Working on a smaller resolution browser? You can maximize your workspace by collapsing your toolbar. This is a user-specific setting that the application will remember the next time you log in.
Enhancements in Explorer
In this release, we have several new enhancements for Explorer:
- Create a table in Explorer
You can add measures, dimensions, and filters to your table. You can also copy the table to a canvas or grid page. In addition, you can modify the display options for your table.
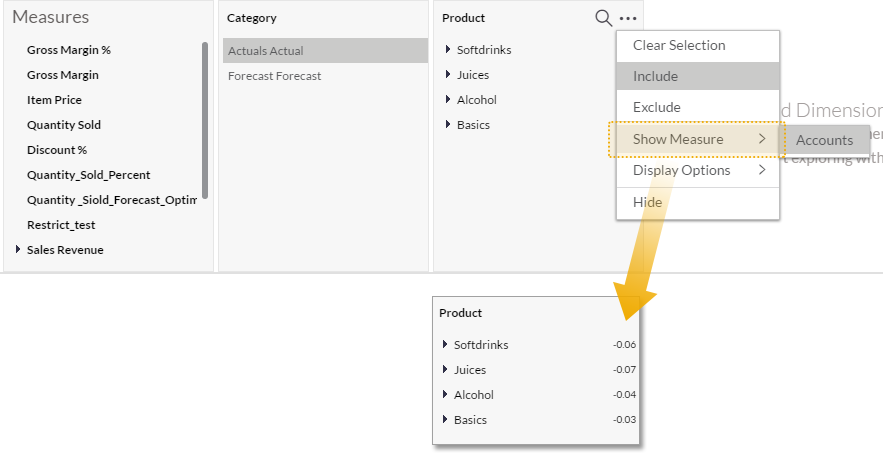
- Show calculated measures in Explorer
Use the Show Measure menu in Explorer to display calculated measures in Explorer.
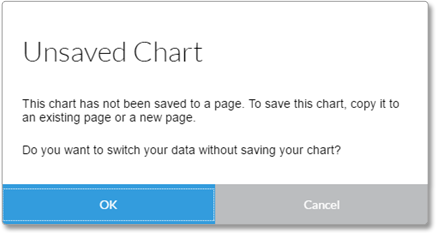
- Warning messages for unsaved charts and tables created in Explorer
We’ve added popup messages that will prompt you to save your chart or table before you switch your data in Explorer, to prevent you from losing your work.
Add error bars to your bar and column charts
Add a dynamic or fixed error range to a bar chart, and customize it the way you want with regard to color, width, labels, and tooltips.
Other improvements
- Display dimension value labels in bubble charts
- Resize table widgets with a single click
Planning
Lock table cells when working with restricted measures
Cell locking is a feature that allows you to fix the value of individual cells in a table so that they are not updated with aggregation. In this release, we’ve extended this capability so that you can lock table cells when you’re working with restricted measures.
Working with currencies in tables
There are a few enhancements for working with currencies in tables:
- All conversion calculations are shown in the member selector, but depending on the context, only some of the conversion calculations can be selected.
- When you add a currency to a calculation, you’ll see a hint that includes the currency country/value (for example, EUR or BRL).
- You can now get to the Select Conversion option from the Calculation dimension as well as from the table quick-action menu.
- In currency-enabled models, “Periodic” is replaced with “Default currency.”
- Learn more about displaying currencies in tables
Predictive
New Build Your Discovery panel
Our new Build Your Discovery panel allows you to quickly configure a machine discovery to see how underlying variables are influencing a given dimension or measure. You can use this panel to select a target analysis column and classification groups (e.g. baseline, comparison).
Digital Boardroom
Better support for single-screen devices
Can’t get to a triple touchscreen display? We’ve optimized the SAP Digital Boardroom so that you can view it more easily on a single-screen device like a laptop.
Initially when you launch the Digital Boardroom, you will start with the Agenda. When you click to view an agenda item on a single-screen device, you will see that the selected item is displayed prominently but the other two “screens” are accessible via small thumbnails on the side. You can even temporarily maximize the selected item so that it fills the screen.
Additional resources:
- Release notes for SAP BusinessObjects Cloud 2016.21
- Video tutorials
- SAP BusinessObjects Cloud Help Resources
- Official roadmap contains more info on future plans, subject to change.
Previous feature summary blogs:
- SAP Managed Tags:
- SAP Analytics Cloud
1 Comment
You must be a registered user to add a comment. If you've already registered, sign in. Otherwise, register and sign in.
Labels in this area
-
ABAP CDS Views - CDC (Change Data Capture)
2 -
AI
1 -
Analyze Workload Data
1 -
BTP
1 -
Business and IT Integration
2 -
Business application stu
1 -
Business Technology Platform
1 -
Business Trends
1,661 -
Business Trends
87 -
CAP
1 -
cf
1 -
Cloud Foundry
1 -
Confluent
1 -
Customer COE Basics and Fundamentals
1 -
Customer COE Latest and Greatest
3 -
Customer Data Browser app
1 -
Data Analysis Tool
1 -
data migration
1 -
data transfer
1 -
Datasphere
2 -
Event Information
1,400 -
Event Information
64 -
Expert
1 -
Expert Insights
178 -
Expert Insights
274 -
General
1 -
Google cloud
1 -
Google Next'24
1 -
Kafka
1 -
Life at SAP
784 -
Life at SAP
11 -
Migrate your Data App
1 -
MTA
1 -
Network Performance Analysis
1 -
NodeJS
1 -
PDF
1 -
POC
1 -
Product Updates
4,577 -
Product Updates
327 -
Replication Flow
1 -
RisewithSAP
1 -
SAP BTP
1 -
SAP BTP Cloud Foundry
1 -
SAP Cloud ALM
1 -
SAP Cloud Application Programming Model
1 -
SAP Datasphere
2 -
SAP S4HANA Cloud
1 -
SAP S4HANA Migration Cockpit
1 -
Technology Updates
6,886 -
Technology Updates
405 -
Workload Fluctuations
1
Related Content
- 体验更丝滑!SAP 分析云 2024.07 版功能更新 in Technology Blogs by SAP
- What’s New in SAP Analytics Cloud Release 2024.08 in Technology Blogs by SAP
- What’s New in SAP Analytics Cloud Release 2024.07 in Technology Blogs by SAP
- What’s New in SAP Analytics Cloud Release 2024.06 in Technology Blogs by SAP
- Align Elements In WebI Like My Oven Timer in Technology Blogs by Members
Top kudoed authors
| User | Count |
|---|---|
| 13 | |
| 10 | |
| 10 | |
| 7 | |
| 7 | |
| 6 | |
| 5 | |
| 5 | |
| 5 | |
| 4 |