
- SAP Community
- Products and Technology
- Technology
- Technology Blogs by SAP
- SAP Fiori 2.0: A Primer on Embedded Analytics
Technology Blogs by SAP
Learn how to extend and personalize SAP applications. Follow the SAP technology blog for insights into SAP BTP, ABAP, SAP Analytics Cloud, SAP HANA, and more.
Turn on suggestions
Auto-suggest helps you quickly narrow down your search results by suggesting possible matches as you type.
Showing results for
Employee
Options
- Subscribe to RSS Feed
- Mark as New
- Mark as Read
- Bookmark
- Subscribe
- Printer Friendly Page
- Report Inappropriate Content
11-03-2016
11:42 AM

This article provides an overview of the embedded analytics concept. It explains why it represents a change in the traditional way of working, and why this is significant for the regular business user.
Introduction
Traditionally, there has always been a strict separation between analytics and transactional work. This was originally in part due to the technical separation of live business data, which was the subject of constant change, and analytical data, which needed to be copied from the live data, cleaned, aggregated, optimized, massaged, and finally stored in data warehouse systems in order to be consumable at a reasonable speed. This separation is reflected nowadays in the offering of tools and applications from many vendors, as well as in the organizational setup we witness with many customers. Indeed, we often see customers who employ specialists to prepare the analyses that are then consumed by the business upon request.
As a result, the availability of insightful analyses of live data streams for the regular business user is still very limited to this day, meaning that many business users have to make decisions based on partial insights and, often enough, outdated information. Due to the lack of perceived ownership and control of system-based data, many users maintain separate spreadsheets in parallel to the system of records, where errors can neither be prevented nor detected, and where the decision-making process becomes very intransparent to the company. Still, in many cases these spreadsheets are better understood and trusted than the systems that hold the original data.
At the same time, there is a wealth of very powerful tools for data scientists and analysts that allow these specialized roles to create reports and analyses, data visualization, and key figures or dashboards from a great variety of data sources. But as mentioned above, there are several challenges to making these insights available to the regular business users who make the decisions:
- Business users have to request analytical reports from the data analyst. This often implies having to cross organizational boundaries and to overcome communication time lags, meaning that immediate questions can’t be solved ad-hoc.
- The power of these tools implies complexities that are difficult to manage by a non-expert. Even if business user would have access to such tools, they will not be able to handle them with the required level of confidence.
- Analytical information is often not very well integrated into the transactional context of a business situation. In most cases, users will need to look up the related analytics in a separate system and create the appropriate filters to have the information at hand that actually relates to their transactional context.
- In traditional analytical systems, analyses are based on preprocessed warehouse data. With recent advances in in-memory data bases such as SAP HANA, the possibility to create analytical reports based on live data has become a reality. However, this is still not the standard.
The intention of the SAP Fiori embedded analytics concept was to create an experience that fully integrates analytics into the transactional context of the user in a way that is simple enough to be understood, and also detailed and powerful enough to be accepted and trusted by the regular business user.
In fact, when talking to people that have no background in enterprise software, the reaction we often hear is “So what?” because this seems to be the naturally expected way of how things should be. Still, only today do modern technologies allow us to enable such an experience at an enterprise scale.
SAP Smart Business

The SAP Fiori launchpad with analytical tiles
With SAP Fiori, we have redefined the way people interact with business software. By breaking down complex transactions into task-oriented apps (following a design-led development process), we have moved into a more consumer-grade experience also for core corporate roles.
As part of this journey, we recognized at a very early stage that the availability of real-time analytical information forms a key part of this change. The SAP Smart Business framework became an important aspect of this approach by allowing key users to define key performance indicators directly on SAP HANA views and to expose them as KPI tiles for the user’s homepage, as well as as analytical applications with predefined drilldown paths and visualizations (to allow the user to explore details of the underlying data and take action).
Users can create their own variants of the Smart Business applications by changing the filter criteria or by selecting different visualizations and saving them as new tile to the home page.
By providing services to analytical data, other apps are also able to enable analytical tiles. This way, the home page becomes a kind of user-defined dashboard displaying the most relevant information and key figures.

A SAP Smart Business analytical application
The beauty of the Smart Business applications is that they are integrated into the application environment. This means that applications can be assigned to end users in the same way as with transactional applications. Furthermore, navigation between apps also works in the same way. Using intent-based navigation, contexts can be transferred between analytical applications and transactional applications, allowing the user to take action based on the insights gathered there. As the Smart Business applications offer only predefined content, they are also easy to use also by non-expert users.
While Smart Business drilldown apps significantly reduce the distance between the business user and the live data – allowing the user to get easy access to analytical reports and key figures – this approach still maintains the separation between the analytical and the transactional worlds.
Embedding this valuable information into the transactional flow of the user – and integrating the KPIs into an environment where these KPIs are actually influenced and created – will provide users with immediate insights into the effect of their actions.
Embedding Analytics
If we want to bring analytics closer to our business users, we need to make analytics available directly in the user’s work environment. Ideally, the user should be able to access the information needed to make a decision in the same place as where this user actually executes the action. But can our design support this?
The SAP Fiori design language is based on standard floorplans that offer an optimized experience for most frequent use cases. The most prominent floorplans in SAP Fiori today are:
- Overview page – A page that offers an overview of a set of tasks or a domain including analytical visualizations, lists of items, and references to apps or tasks within that domain.
- List (report) page – A page that lists items based on a certain query. The page provides a powerful means to filter large sets of items and navigate to a more detailed view of these items.
- Object page – A highly flexible page that can be used to display all aspects of a single object. The page is optimized to accommodate information of various complexities and volumes.
These are the most frequently used floorplans in SAP Fiori, and finding ways to enhance these with analytical information will helps us take a significant step forward.

A typical navigation path would take the user from the home page into an overview page, to a list page, and by selecting an item in the list on to the object page for that specific item.
Both the home page and the overview page are not the places where users mainly take action. These pages are hubs that help the user to monitor his or her area of responsibility and to create coherence across a domain. Even though these places do provide the possibility to display analytical information, they are nevertheless not embedded enough into the transactional work. Therefore, the concept of embedded analytics focuses on the list page and the object page as the places where the work gets done, as well as on creating consistency and integrating analytical information across all pages.
Analytical List Page

A standard list report page with variant management, a filter, and a large table
The typical list report page was designed to manage large sets of data. A typical list report handles several thousand items and therefore requires a powerful filter control, the filter bar.
The list report covers all functionality available in a classic SAP GUI report, where the filters are defined in the initial selection screen and where the list is displayed once this selection is released. The list report offers this functionality without additional navigation. It uses a powerful and personalized filter control located at the top of the list. Depending on the performance and system load, the filter can be automatically applied or triggered by the user updating the table below.
Taking into account that the list report is designed to handle large amounts of items, it’s clear that introducing analytical features and tools for data visualization could help the user to better understand the data and make more informed decisions.
With the SAP Fiori embedded analytics concept, we’ve explored various ways to enhance the classic list report by integrating analytical functions such as:
- Content visualization
- Visual filters
- Analytical drilldowns
- Multidimensional analyses
- Progressive disclosure on KPIs
Visualizing Content

Instead of a list, this design for the list report offers a chart to visualize the content (early design exploration)
As a first step, we explored ways to offer an alternative visualization in addition to the table. Using a chart instead of a table makes it much easier for the user to understand the data at hand and draw conclusions. However, pure visualization isn’t enough if the user directly wants to take action at item level. How can we strengthen the link between visualization and item-level data?

Combing tabular and visual representations allows the user to interactively select or filter the related content (early design exploration)
Next, we considered offering the user complete control over visualization. The user would be able to define whether he or she wants to see charts, tables, or a combination of both.
The charts are interactive and allow the user to influence the data in the table (when displayed). So far, we have identified two ways that such an interaction between a chart and a table could look:
- Master-detail mode: The selection in the chart filters the items visible in the table to those that match the selection in the chart.
- Selection mode: The selection in the chart also selects the corresponding items in the table so that a user can take action on these.
In our current exploration, we found that both options are valid and, depending on the task, either of these options is favorable.
Visual Filters
The visual filter as a set of simple interactive charts representing different aspects of the data. Selections are directly reflected in the other charts and in the page content.
Using a chart to filter the contents of a large set of items is intuitive. It’s also helpful to the user because it provides immediate feedback on the structure of the data. However, there are various dimensions along which the user would like to filter and explore the data, and not all of these need to be in focus as with the large chart above. We therefore introduced the idea of a visual filter. The filter consists of multiple smaller interactive charts that display different aspects of the data. These charts are dependent on one other so that selecting one chart influences the others, and the effect of every filter can be directly displayed in the visualization.
The visual filter is not only a great way to filter the data in a very simple and intuitive way along a few main dimensions, but it’s also a summary of the data contained in the data set. Huge sets of information can be condensed in a few expressive charts.
Although the visual filter doesn’t replace the more powerful text-based filter bar, it offers a complementary way of narrowing down large data sets.
Enabling Drilldown

The user can drill down by predefined dimensions which are then also reflected in the item view in the table (early design exploration)
Similar to the analytical drilldown applications in SAP Smart Business, the embedded analytics concept foresees that users can drill down along certain dimensions in the list report page as well. Using the chart, the user can identify the values and measures, and select the dimensions he or she would like to explore.

The exploration in the chart is reflected in the table by applying appropriate grouping (early design exploration)
By combining the chart and table, the results can be directly reflected at item level, connecting the aggregated level to the individual entries. Drilldown dimensions can also be used to control the grouping in the table to best reflect the underlying questions.
This way, the separation of the analytically-oriented drilldown applications and the list report allowing actions at item level are eliminated. The user can now explore individual items and take action at any time.
Multidimensional Analysis


Multidimensional analysis (early design exploration)
Once a user has filtered down a large data set, the next step will often be to run a more detailed analysis on this set of items. At this point, most users would typically export the data and analyze it using third-party tools. This is not beneficial to the accuracy or to the timeliness of the analysis, especially when comparing this to an analysis conducted directly within the system of records and based on live data.
We want to make sure that such multidimensional analyses can be seamlessly integrated into the application environment. By switching to an analysis mode, the user can define dimensions and measures along which to analyze the data. Changes in the filter are immediately reflected between both views.
Such analyses require more complex data models and powerful table controls that are already available in our analytical offerings. By transparently integrating these tools into the list report, we can reuse the context that the user has created in both modes.
KPI Tags to KPI Page

Two KPI tags in the title area display global figures that are important to guide the work of the user during the entire process. By selecting a tag, additional details are revealed in a popover.
While working with large data sets, users often need to keep track of key figures that represent target values or thresholds for which their work is optimized. How can we offer a flexible way to display key figures in different contexts? And how do we make sure that the information is neither too detailed nor too limited to be useful?
In our explorations, we’ve been working on an end-to-end design that defines representations of KPIs in various sizes for use in different contexts. Sizes range from an ultra-compact tag to a full page representation of a KPI. All these representations are connected, allowing the user to explore a KPI step by step by navigating from compact to more detailed representations.
In the case of the list report, global KPIs can be placed as tags in the title bar. Clicking or tapping a tag opens a popover which reveals additional details pertaining to the KPI, such as thresholds, extreme values, and timelines. Selecting Details allows the user to navigate into a full screen representation of the KPI.
The concept of progressively disclosing all levels of detail for a KPI can also be applied to other use cases. The benefit is that it allows us to reduce the usage of permanent space on the UI without having to discard information that a user might eventually need at a later point.

Overview of the different KPI representations ranging from a tag to a full KPI page
Detection and Automation
One further detail that is indicated in the images above is the potential to run statistical analyses and learning algorithms to identify exceptional patterns and outliers in the data, which might indicate a need for action by the user.
Putting All the Pieces Together

The analytical list page enhances the regular list report by applying KPI tags, a visual filter bar, interactive charts, and multiple visualization options
In the final concept, we can see how all these pieces come together to create an environment where the user is able to control the way in which data is presented. While the option of working using only the classic filter bar and the table is still there, the user now also has the option to switch on the analytical capabilities discussed in this article to support his or her work.
Object Page

A standard object page in the Blue Crystal (SAP Fiori 1.0) design with some data visualization in the header area and a comprehensive table in the content area
The object page is the standard floorplan to create, edit, and display detailed information about an object. This extremely powerful and flexible floorplan comes in different variants and configurations, which allow us to present different types of content in the most efficient way.
- The object page header compensates for one of the most important limitations we had in the object view in the first version of SAP Fiori. Its content structure offers full flexibility and richness, while also offering ways to hide the header information when the focus is on the content area. The object page header makes use of the dynamic page layout, which uses a snapping behavior that collapses when scrolling (as we know it from many current websites or applications).
- The object page content area follows two basic content structures: a) anchor-scrolling on a long flat page, with various short sections offering a perfect overview of all aspects of an object; and b) tabbed with several independent subpages that can be switched using a tab strip, which accommodates long and complex content sections such as tables.
With the embedded analytics concept, we addressed the question of how analytics could help us to improve the usage of analytical key figures in the header area as well as within the highly aggregated content sections of an anchor-scrolling object page.
Header KPIs
The purpose of the object page header is to expose the most important information about an object. Often, this header area serves as the initial check before the user digs deeper into the content of the object to obtain more details or to take action. Therefore, the header content needs to remain limited in terms of its complexity and richness.
On the other hand, we know that KPIs as such are of limited value if the user is not also able to explore additional details such as trends or the development of a KPI over time. Ultimately, it should be possible for the user to jump off into a detailed analysis of a KPI when needed to identify the key influences and reasons for the current status.
Also, the user might want to adjust certain aspects of a KPI, such as to explore one specific instance or a certain object type, without much effort. For instance, certain products might have a longer turnaround cycle than others and the sales figure should therefore be considered based on a longer interval. This is something inherent to the business user’s domain knowledge and not a generic analytical rule.

KPIs can be embedded into the object page header. When selecting the KPI, a popover is triggered where the user can see more details about the KPI and can adjust some aspects as well as jump off into a detailed analysis (early design exploration)
Following the approach that we introduced for the analytical list page and the KPI tags, we defined a way for the KPI in the object page header to be expanded using a popover that contains additional details about that KPI, as well as some controls to adjust the KPI within this object, and finally the possibility to open the KPI in a corresponding analytical application.
The early design exploration shown above reveals different time-based visualizations of the KPI as well as alternative visualizations. However, in our validations this turned out to be too complex and not very useful. Instead, we limited the information to some additional KPI attributes such the target value and the deviation, in addition to a single time-based visualization. In addition to this, we explored the option to provide proactive hints for exceptions and statistical outliers in the data set. Any further functionality will be offered on the KPI detail page.

The current design of the object header KPIs including the popover to display more detailed information
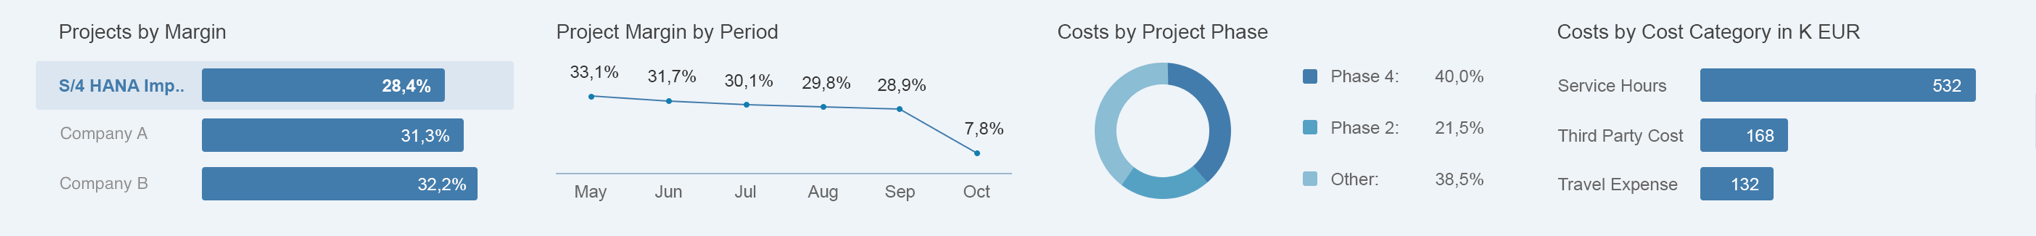
Visual Filter as Content Aggregation

The object page with the unified KPI visualizations and with the visual filter bar as interactive aggregated preview of the related data set.
As the object page usually consists of one long-scrolling page with different content sections that provide an easy overview of all aspects of an object, it’s essential to keep the individual content sections short. If the sections become too long, the page will grow to be too large and the user will lose his or her orientation.
Instead of embedding large tables of related items, we came up with two possible alternatives: embedding an extract of the table into the page, or finding another way to aggregate the information.
- Embedding an extract of the table works if there is a priority in the related data set so that the most relevant items can be displayed in the shortened version of the table. If all items in the table are equally important, there is no way to find a relevant set of items to display.
- Alternatively, an aggregation of the related data set can help to summarize the data and reveal its most important aspects. For this end, the same filter bar used to summarize and filter the table content can also be used to display a summary of the report embedded into the object page. What’s more, offering the same interactive filtering behavior can help the user explore the content even further. At any time, the user can navigate to the full report for details and take action.
In short, embedding interactive analytical visualizations into the object page allows us to compress the information and make a complex data set easy to consume.
Take Aways
The award-winning design concept of SAP Fiori embedded analytics represents a further enhancement to the latest SAP Fiori 2.0 design.
Based on the design principle that software should be role-based, we have identified the need for business users in various roles to be able to access analytical information in the context of their regular work. To overcome the traditional separation of analytical tools and reports, we’ve identified places in the existing user environment which can be enhanced with the use of analytical capabilities. This allows the user to better explore information, to have highly complex data summarized in simple visualizations, and to ultimately make better-informed decisions.
This article described the core aspects behind the SAP Fiori embedded analytics concept, and how elements such as the KPIs, the overview page and the object page would be affected. Nevertheless, there are many aspects that we haven’t yet explored, such as how regular workflows could also benefit from visualizations and analytical or statistical methods. We will continue bringing these aspects into the standard patterns and floorplans to best support our users during their work, leveraging the power of in-memory computing with SAP HANA.
Currently, we are working on the implementation of some of these concepts, such as the analytical list report and the visual filter bar – as well as the enhancements to the object page – through the standardization of KPIs and the progressive disclosure of KPIs. We hope that these will soon become available as part of the SAP Fiori Elements and your SAP Fiori 2.0 environment.
- SAP Managed Tags:
- SAP Fiori
5 Comments
You must be a registered user to add a comment. If you've already registered, sign in. Otherwise, register and sign in.
Labels in this area
-
ABAP CDS Views - CDC (Change Data Capture)
2 -
AI
1 -
Analyze Workload Data
1 -
BTP
1 -
Business and IT Integration
2 -
Business application stu
1 -
Business Technology Platform
1 -
Business Trends
1,658 -
Business Trends
109 -
CAP
1 -
cf
1 -
Cloud Foundry
1 -
Confluent
1 -
Customer COE Basics and Fundamentals
1 -
Customer COE Latest and Greatest
3 -
Customer Data Browser app
1 -
Data Analysis Tool
1 -
data migration
1 -
data transfer
1 -
Datasphere
2 -
Event Information
1,400 -
Event Information
74 -
Expert
1 -
Expert Insights
177 -
Expert Insights
346 -
General
1 -
Google cloud
1 -
Google Next'24
1 -
GraphQL
1 -
Kafka
1 -
Life at SAP
780 -
Life at SAP
14 -
Migrate your Data App
1 -
MTA
1 -
Network Performance Analysis
1 -
NodeJS
1 -
PDF
1 -
POC
1 -
Product Updates
4,575 -
Product Updates
388 -
Replication Flow
1 -
REST API
1 -
RisewithSAP
1 -
SAP BTP
1 -
SAP BTP Cloud Foundry
1 -
SAP Cloud ALM
1 -
SAP Cloud Application Programming Model
1 -
SAP Datasphere
2 -
SAP S4HANA Cloud
1 -
SAP S4HANA Migration Cockpit
1 -
Technology Updates
6,871 -
Technology Updates
479 -
Workload Fluctuations
1
Related Content
- Watch the SAP BW Modernization Webinar Series in Technology Blogs by SAP
- Import Data Connection to SAP S/4HANA in SAP Analytics Cloud : Technical Configuration in Technology Blogs by Members
- Exploring ML Explainability in SAP HANA PAL – Classification and Regression in Technology Blogs by SAP
- What’s New in SAP Analytics Cloud Q2 2024 in Technology Blogs by SAP
- 10+ ways to reshape your SAP landscape with SAP Business Technology Platform – Blog 7 in Technology Blogs by SAP
Top kudoed authors
| User | Count |
|---|---|
| 17 | |
| 15 | |
| 11 | |
| 11 | |
| 9 | |
| 8 | |
| 8 | |
| 7 | |
| 7 | |
| 7 |