
- SAP Community
- Products and Technology
- Technology
- Technology Blogs by SAP
- What’s New in SAP BusinessObjects Cloud and SAP Di...
Technology Blogs by SAP
Learn how to extend and personalize SAP applications. Follow the SAP technology blog for insights into SAP BTP, ABAP, SAP Analytics Cloud, SAP HANA, and more.
Turn on suggestions
Auto-suggest helps you quickly narrow down your search results by suggesting possible matches as you type.
Showing results for
cchoy
Participant
Options
- Subscribe to RSS Feed
- Mark as New
- Mark as Read
- Bookmark
- Subscribe
- Printer Friendly Page
- Report Inappropriate Content
10-03-2016
7:13 PM
This blog covers some of the latest new features and enhancements in SAP BusinessObjects Cloud and SAP Digital Boardroom release 2016.19. Please refer to the release notes for more details.
Highlights of this release include:
- Self-service configuration of SAML authentication
- Multiple enhancements for variance
- Create geospatial models from live HANA calculation views
- Automatic scaling of non-spreading dimensions with weighted spreading
Core: User Authentication
Self-service configuration of SAML authentication
If you have your own corporate SAML Identity Provider, you can now choose to use that for single sign-on to SAP BusinessObjects Cloud. You can configure this directly within the application, without needing to submit a ticket or involve the SAP BusinessObjects Cloud operations team.
- Note: This feature is only available once your tenant has been migrated by our operations team to a URL in the form of “yourCustomName.region.sapbusinessobjects.cloud”. Please see: Instructions and FAQ for tenant admins >
- How to enable SAML Single Sign-On (SSO) >

Core: Data Analysis, Stories, and Tables
Variance: Multiple enhancements
This release brings a number of enhancements for working with variance in SAP BusinessObjects Cloud.
- Show/hide and edit variance labels
Variance labels can now be toggled on and off, and be displayed either above or below the chart. The variance label text can be customized as well.

- Select the versions to be included in the base chart
Not all versions need to be included in the base chart when you are creating a variance chart. The versions included in the base chart will determine the appearance of the variance axis.

- Special handling for non-existing data points
This is a handy new feature that allows you to choose whether you want to show a value that does not exist as a variance.
For example, let's say you had planned to sell a product last year, but did not have any data for actuals (no sales). In this case, you can treat the data as zero to show that the variance is off by 100%. Or if the situation was reversed and you sold a certain product last year but there were no sales this year - again you could treat the data as zero and show that the variance is off by 100%. But if you launched a new product this year, it would not make sense to show the variance for this as there as there is no data from the previous year - in this case, you would not select the option to set no data as zero.

- Create a variance chart with two different measures
This enhancment allows you to add the variance from any two measures, including calculated and restricted measures. The example below shows how we compare two time restricted measures.

Apply a threshold on a measure by measure basis within a Story
Thresholds have just gotten more powerful. Instead of using the same threshold rule for all measures, you can now specify the threshold on a measure by measure basis such that each measure or calculation can be displayed with a completely different threshold.
It’s also easier now to change the range of a threshold, and you can turn the threshold tooltip on or off. Support for percentages is improved as well.

Other improvements
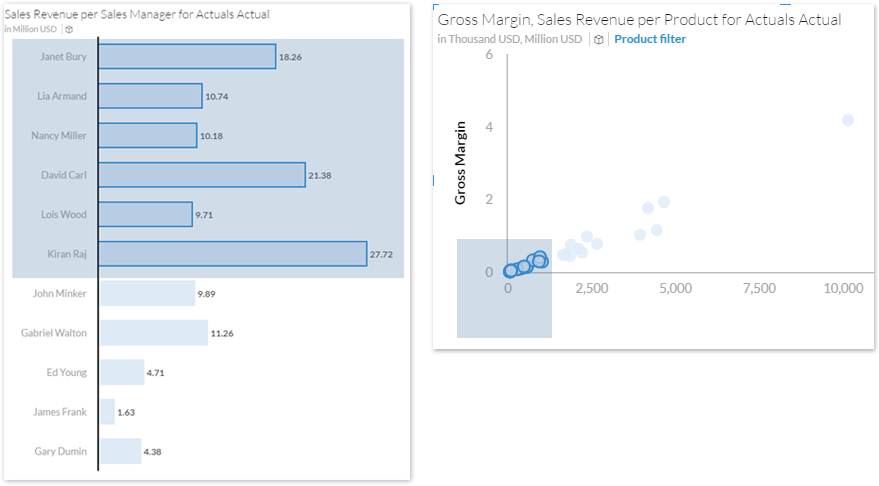
- Enhanced marquee selection
Want to quickly select things within a chart? Marquee selecting is improved so that you can begin your selection outside of the plot area, and see the items that are being selected as you drag your cursor across a chart.
- Improved chart building experience
The action menu is now enhanced with expandable measure and dimension tokens.
Core: Location Analytics
Create geospatial models from live HANA calculation views
We now support the creation of geospatial models based on live HANA calculation views. In order to import a location-enabled model from a live HANA calculation view, you will first need to perform a few data preparation steps in SAP HANA Studio.


Predictive
Preview predictive forecasts
SAP BusinessObjects Cloud allows you to run predictive time-series forecasts on your data within a story grid. In this release, you can preview the existing values and predicted values for booked cells after running a time-series forecast, and then choose to use either the existing value or the forecast value for each period before populating the story grid.

Planning
Scaling of non-spreading dimensions
We’ve improved the way booked values of non-spreading dimensions are handled with weighted spreading; these values are now scaled instead of being equally distributed.

Currency conversion dependencies
Need to know which calculations can be exposed in a table? The Select Conversions dialog now allows you to easily see which calculations are dependent on the conversions that are available.

Other improvements
- Support for data entry and copy/paste into unbooked restricted cells.
Additional resources:
- Release notes for SAP BusinessObjects Cloud 2016.19
- Video tutorials
- SAP BusinessObjects Help Resources
- The official roadmap contains more info on future plans, subject to change
Previous feature summary blogs:
- SAP BusinessObjects Cloud release 2016.18
- Summary of new features for SAP BusinessObjects Cloud - July/Aug 2016
- SAP Managed Tags:
- SAP Analytics Cloud
1 Comment
You must be a registered user to add a comment. If you've already registered, sign in. Otherwise, register and sign in.
Labels in this area
-
ABAP CDS Views - CDC (Change Data Capture)
2 -
AI
1 -
Analyze Workload Data
1 -
BTP
1 -
Business and IT Integration
2 -
Business application stu
1 -
Business Technology Platform
1 -
Business Trends
1,658 -
Business Trends
110 -
CAP
1 -
cf
1 -
Cloud Foundry
1 -
Confluent
1 -
Customer COE Basics and Fundamentals
1 -
Customer COE Latest and Greatest
3 -
Customer Data Browser app
1 -
Data Analysis Tool
1 -
data migration
1 -
data transfer
1 -
Datasphere
2 -
Event Information
1,400 -
Event Information
74 -
Expert
1 -
Expert Insights
177 -
Expert Insights
348 -
General
1 -
Google cloud
1 -
Google Next'24
1 -
GraphQL
1 -
Kafka
1 -
Life at SAP
780 -
Life at SAP
14 -
Migrate your Data App
1 -
MTA
1 -
Network Performance Analysis
1 -
NodeJS
1 -
PDF
1 -
POC
1 -
Product Updates
4,575 -
Product Updates
391 -
Replication Flow
1 -
REST API
1 -
RisewithSAP
1 -
SAP BTP
1 -
SAP BTP Cloud Foundry
1 -
SAP Cloud ALM
1 -
SAP Cloud Application Programming Model
1 -
SAP Datasphere
2 -
SAP S4HANA Cloud
1 -
SAP S4HANA Migration Cockpit
1 -
Technology Updates
6,871 -
Technology Updates
482 -
Workload Fluctuations
1
Related Content
- What’s New in SAP Analytics Cloud Q2 2024 in Technology Blogs by SAP
- Third-Party Cookies and SAP Analytics Cloud in Technology Blogs by SAP
- SAP Analytics Cloud: New ‘Present’ mode Settings Impact on SAP's Planning Business Content in Technology Blogs by SAP
- What’s New in SAP Analytics Cloud Release 2024.09 in Technology Blogs by SAP
- 体验更丝滑!SAP 分析云 2024.07 版功能更新 in Technology Blogs by SAP
Top kudoed authors
| User | Count |
|---|---|
| 15 | |
| 11 | |
| 10 | |
| 9 | |
| 8 | |
| 8 | |
| 7 | |
| 7 | |
| 7 | |
| 7 |