As part 2 of the S/4 HANA Embedded Analytics blog series (http://bit.ly/2d3VfpJ ) I would like to highlight the details about the S/4 HANA Embedded Analytics Architecture in this blog. Before I get into the technical details of the S/4 HANA architectural stack I would like to describe the journey of the data from the Tables to Tiles. We would look at the journey of the data generated via the numerous transactions in the transactional systems like an S/4 HANA core. We would then track this data residing in several tables and track how they make their way into the Fiori Launchpad as Analytical Tiles helping us make decisions. In order to make things more concrete, let us examine how the end state of the data looks like. In the figure below we have the standard content from SAP for Purchasing Analytics in upcoming S/4 HANA 1610 release in the Fiori Launchpad. We would now pick one of the tile below and delve under the hood.

Strange it may sound but the small tile shown in the Fiori Launchpad below depending upon the model complexity could be a combination of 15-20 transactional tables and sometimes even more, with each table having columns ranging from 150-350 columns. What you see below is a standard tile which is composed of multiple tables from the S/4 HANA core. This is very important for us to appreciate that the end user now has access to this huge volume of data which changes in real time as the transactions go through the system all “live” at the “point of decision”. What appears as a small step is in fact the first step towards the democratization of data with S/4 HANA Embedded Analytics. No longer a user, needs to wait for the complex process chains of replication to be completed to give him the status of the business. This simple yet powerful small step now accelerates the speed of decision making mandated by the digital economy.

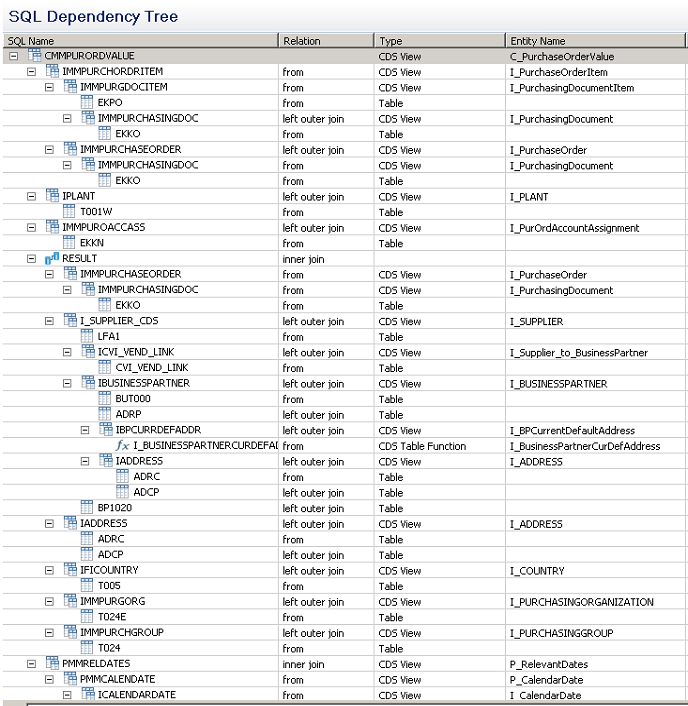
As we now are aware of the powerful transformation happening via the tables to tile journey, lets us explore in details each layer of the S/4 HANA Embedded Analytics. For all these varied tables to come together we would (you guessed it correctly) need a Virtual Data Model (VDM). For us to connect the massive amount of information together we would need to combine the tables via joins and associations. Well this is an example of how a VDM could look like.

Important to note that the above VDM could be modeled in any manner you wish to choose like SQL. However in the S/4 HANA Analytics we the Core Data Services as a common basis for the domain specific frameworks. So if you want to do search, analytics or planning you could reuse the unified model.

While CDS could be ABAP managed or HANA managed, in the S/4 Analytics Architecture context we use the CDS ABAP Integration as this provides us the benefits of consistent lifecycle management and extensibility. This could leverage the DDIC semantics and can provide us with highly reusable and extensible CDS artefacts. A very important companion to the ABAP managed CDS is the concept of annotations, which helps to enrich the metadata with multiple consumer specific vocabularies. Combining the CDS scripting and the annotation helps us to write complex VDM in a similar, reusable way than through the traditional SQL procedures. In the figure below you would see the CDS View with the annotations and the generated SQL view which would be executed at runtime.

In the figure below you would find the view and all the structure of the base tables. This process brings the end to the model definition process. In the next step we could service enable the whole VDM with means of a simple annotation called as @OData.publish: true.
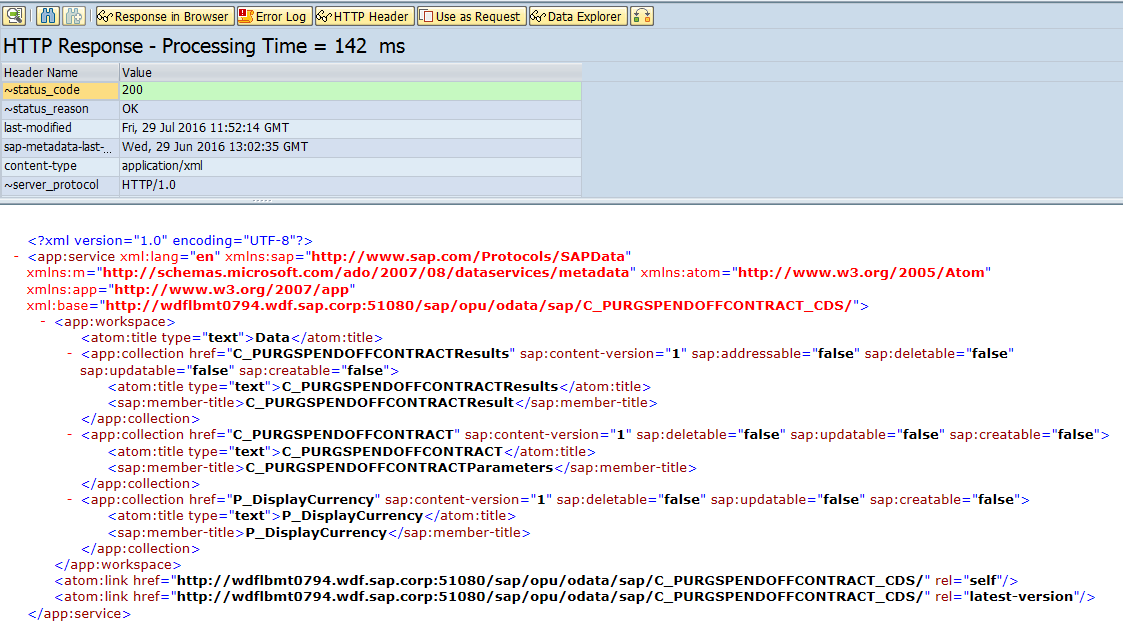
Once the service is registered in Gateway Server you could test the service in the SAP Gateway client and would have the oData available for consumption in the browser. At this point in time you have the entire tables as depicted above exposed as a service available as an oData for generating or developing the UI artefacts.
We could choose to programmatically develop the UIs for consumption or use a tool like SAP S/4 HANA Smart Business for creating the tiles which can be rendered in the Fiori Launchpad. Smart Business allows us to develop KPIs and related artefacts like Tiles just by configuration in matter of minutes.

Putting it all together you get the S/4 HANA Embedded Analytics Architecture stack. So in just few simple steps you unleash the huge volume of tables modeled via ABAP CDS, enriched with annotations and service enabled via Gateway available to the end user for insight to action scenario. The end user could now see the data “live” as reflected in his tiles as the numerous transaction volumes pass through the system. In this blog we illustrated the journey of the data from the tables to tiles and consumption via the oData. We also have the alternative way of consumption of the CDS views via the analytical engine in the SAP BI suite of products.

