Unexpected results from the VSR optimizer always make the users upset, unless we can understand the unexpected solutions. In this article we will show how to apply this tool to understand the unexpected results. The Explanation Tool is not a new topic. Marcus Zahn wrote the article Optimizer Explanation Tool before. If you have questions regards activation, access and navigation of Explanation Tool, please refer that one. If you use TM with HANA, please clear the protocols of the explanation tool regally by setting SCMTMS/PLN_EXP_DELETE to release the memory.
As Marcus mentioned in his blog, the aim of this tool is to show the input and the results to analyze errors on a very detailed level, or to quickly check what happened in the optimizer run. So at first we will explain what is shown in Explanation Tool and what the meaning is. Then we will show with a simple example how to use explanation tool. At the end some tips for advanced users to analyze sophisticated scenarios are listed.
Information shown by Explanation Tool

Content
In “Input” you can find the master data (transportation network, schedules, resources, and so on), TM business documents (freight units, freight orders, and bookings) and constraints like incompatibilities and profiles (parameters).The data you can see here is what the optimizer really receives and may be not what you expected! It is caused mainly by the inappropriate selection profiles. One another reason is Context Determination. In this case the optimizer possibly receives more data and these data may have huge impact on the optimizer run. So before you start to analyze the scenarios, check the input data and selection profiles.
The “Result” section contains solution information. In the “business documents” you can find how and when a business document is planned or possibly some messages and warnings why a business document cannot be planned. Analogically the detailed information for all resources is in the “Resources”. With the help of the messages you may correct your scenarios and get the expected solutions. In the next section we will show you how to use the messages.
If you want to have a detailed overview of the solution, you can check the “Solution Details”. It contains “Costs”, “Progress” and “Key Figures”.
The Costs contain the final cost with not only the different cost parts but also their contributors. For example, fixed costs has the contributor number of used vehicles, the contributor to FU costs is number of not performed FUs. The contributor with unexpected values indicates which related costs or settings should be adjusted. For example, if the number of used vehicles is more than you expected, you may try to enhance the vehicle fixed cost.
The Progress shows the cost improvement over time during an optimizer run which is important for setting the run-time correctly. For more detail please refer run-time.
In the Key Figures you can find some technical information about the run, i.e., how many threads are used. Moreover it offers a summary about what happened on how many objects, i.e. how many FUs are totally planned. This summary is mostly useful for the administrative analysis.
Analyze Scenario with Explanation Tool
In our scenario one 10 ton FU from Stuttgart to Bremen and one TRUCK_SMALL with capacity 20 Tone are selected. We expected that this FU will be transported by the truck. But the optimizer does not plan the freight unit.
Let us check the explanation Tool if we have any information about the FU, why it is not planned.

The message tells us that there is no valid route due to the transportation mode constraints. So we check the mode constraints on the freight units.
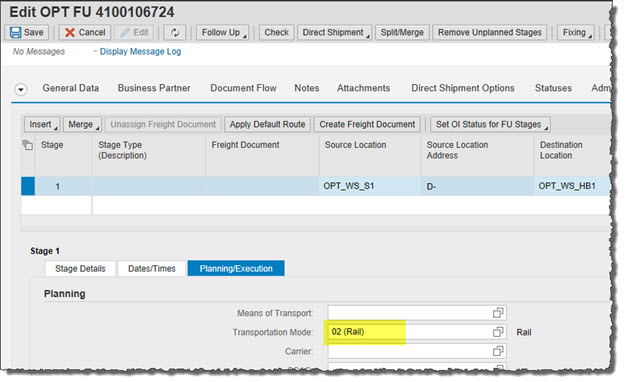
Freight unit should be transported by mode 02(Rail). But we have only trucks for road.
Some Tips for analysis
As described earlier, we want to emphasize here again: it is important to check the input data and the selection profiles before you start to analyze the scenarios.
- For analysis make the scenario as small as possible!
In the real world scenarios are of course much more sophisticated and errors are not easily found as in the given example. Instead of analyzing a big problem, the problem will be split into small problems if possible.
For example, image you want to know why the optimizer did not plan a freight unit on a certain resource.
At first select just this freight unit and this resource and run the optimizer. If the freight unit is not planned, you know that it is not possible to use this resource. In this case you should check in the result section if there are any explanations why this freight unit could not be planned. If the freight unit is planned, you should check the costs to determine if this solution is more expensive than the one proposed by the optimizer.
If this does not help to find the reason, there might be side effects from the other freight units or resources in the original scenario. In this case also select the resource on which the freight unit is planned in the original scenario or the freight units that are planned on the same freight order and run the optimizer again. Analyze the results and check if this solution is cheaper or why the freight unit does not fit on the planned freight order.
- Manually plan the expected solution
And last but not least, you can try to plan the expected solution manually in the TM system. If you get warnings, then you know how to correct the scenario. Otherwise, compare the cost of the expected solution and the solution from the optimizer run.
With the tips described above you have the possibility to understand most of the results by yourself. If you want to adjust the costs, you may get some ideas about cost settings through the article: Cost for trucks and trailers.
