harsh.satsangi asked an interesting question after my previous From Wroclaw to Warsaw and back: IoT analysis with SAP HANA SQL blog post: "I want to understand how to render a map with lati, longi data on SAP Lumira or UI5 easily." Well, define 'easy' :wink: Let me show you, and then you tell was it easy or now.
So, in that previous post I acquired a dataset into SAP BusinessObjects Lumira from patrick.colucci's SensorPhone app persisted in SAP HANA database of HCP Trial via IoT Services. The dataset in Lumira has a time-stamp, latitude and longitude coordinates, altitude and speed (in km per hour) measures, and looks like

Here comes the challenge. I need to have a column (a dimension) that could become my geography dimension and that column must have a text data type. For that I need to use a trick and to create such a column, eg. by concatenating latitude and longitude coordinates. In Lumira I selected "Create a calculated dimension", named that new dimension the 'LocationPoint', and used a formula {LATITUDE} + "-" + {LONGTITUDE}. The new dimension is created as a text column, because I used a string "-" in concatenation.

Now, let me turn this new column into a geographic dimension by choosing "Create a geographic hierarchy..." -> "By Latitude/Longitude"

Assign latitude and longitude dimensions and leave the geographical level as "Other":
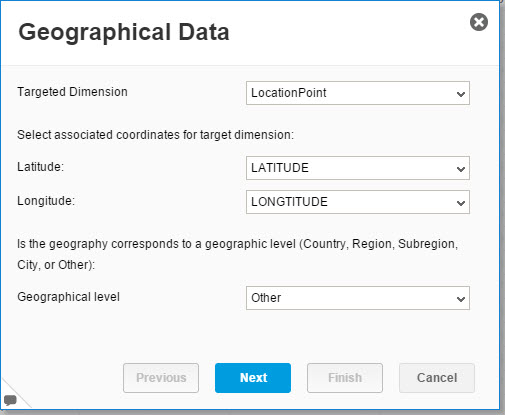
Let Lumira calculate Country, Region, and Subregion for each point captured by SensorPhone, while I was driving. Click Finish.

Lumira created the new geographical hierarchy and I can see what voivodeships in Poland I was driving through while collecting sensors' data from my smartphone: Mazowieckie, Łódzkie, Wielkopolskie and Dolnośląskie [have fun reading these names :wink: ] Sounds just right!

Let's try to visualize this data now. In his question Harsh asked specifically "to render a map with lati, longi data on SAP Lumira" and for that I will need to use "Geo Map" chart based on Esri ArcGIS technology (see eg. tammy.powlas3's post SAP Lumira 1.29 - Enjoying the ESRI Features for some more information).

Now I pick "Gray" map, the 'Choropleth' data point type for the layer, 'LocationPoint' - the lowest level of my geo hierarchy - as the Geo Dimension, 'KMpH' (speed) measure as the Color, and change the Palette to 'Traffic Light' for the higher contrast. Green is 160 km/h, and Red is 0 km/h. Well, ok :smile: .
Here is a chart with the driving speed measured at latitude and longitude coordinates. You can see some gaps - this is when the app was not posting phone's sensor data to the IoT service, eg while outside of the cellular network coverage.

Slowest (red) are driving through cities, and the stop at a gas station (compare to the chart in the previous post) or to this another geo-based chart of the average speed by sub-regions, where indeed cities (Warsaw, Wrocław, Łódź) are the slowest locations.

I hope this answered the question. Please let me know if it was easy!
-Vitaliy aka @Sygyzmundovych
