"sap.gantt" is the new library introduced recently to create a Gantt Chart control in SAP UI5. This control is basically used to represent our data in graphical form and we can further perform other operations on it.
In this document , in Part I , we will see how to get started with the Gantt control. We will be creating a Gantt Chart with Table control.
In Part II , we will further create another chart and see how we can implement drag and drop functionality across the 2 charts.
Here is a screenshot of how the output will look like for Part I.

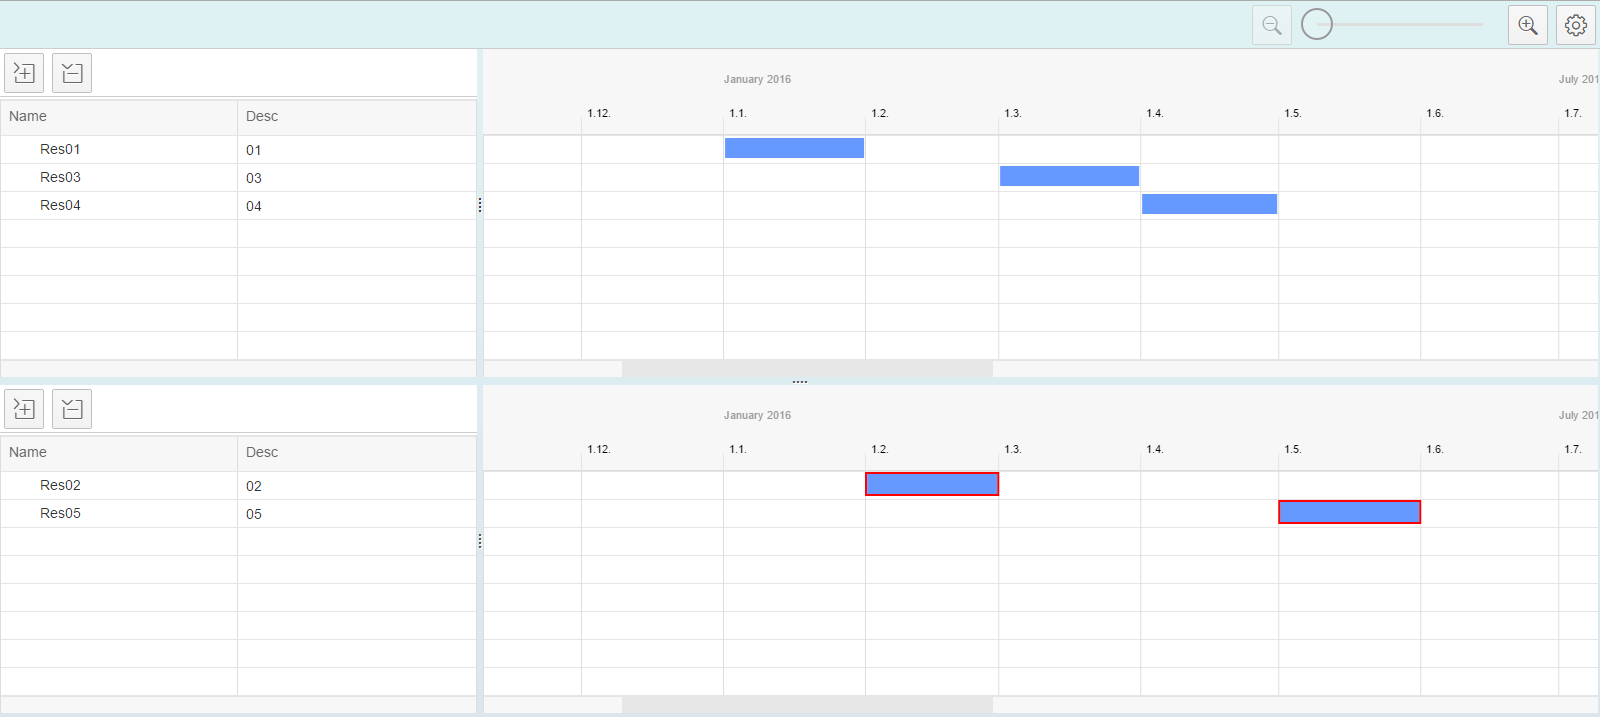
Here is a screenshot of how the output will look like for Part II.
Now let's start with the coding part.
Part I :
First of all we need to include the library "sap.gantt".
VIEW.XML :
In the view we first create a GanttChartContainer and add GanttChartWithTable as it's aggregation. The table used in this control is a "sap.ui.table.Table" which is inbuilt. So inside the columns aggregation of GanttChartWithTable, we refer to "sap.ui.table" library controls like 'Column' and 'template'. Here is a screenshot of the xml view code.

Note : I observed that it's better to mention the height of GanttChartContainer, otherwise sometimes the output behaves differently.
CONTROLLER.JS :
Inside the controller we will now refer to our Gantt chart and create data and shapes for it. Here we do this in the onInit function.
Note that the data structure used for the chart is of the format :
var oData1 = {
"root": {
"id": "root",
"level": "root",
"children": []
}
};
Inside the children array you can add the main data. Here is the sample data we used to create our chart :

Now we assign this data to a json model and set it our control. The method used to add rows is "bindRows". We also set shapeDataNames and set the shapes to our chart. Here we will be creating rectangle shape.

Note : The parameter of setShapeDataNames should be an array. If you miss this, then no output will be seen.
For creating shapes, sap.gantt has provided "sap.gantt.shape" class. You can explore it further. Here is the code for configShape function which sets the shapes to our gantt control :

The key and the shapeDataName is kept as "order". This is what used while creating out data in the variable "oData1".
time and endTime specify the shape's start and end points.
enableDnD property enables the shape to be draggable and droppable.
So this is how you can create a basic Gantt chart. You can also refer to the snippix link:
http://veui5infra.dhcp.wdf.sap.corp:8080/snippix/#43447
Part II :
Once the first chart is created we will move further towards drag and drop functionality. We will create 2 charts for this. And we will make use of the event "shapeDragEnd". This event is triggered when the shape drag ends.
VIEW.XML
In the previous view, we will simply add a new GanttChartWithTable control. in the code we will add the events as follows :
<GanttChartWithTable id="GanttChartWithTable1" shapeDragEnd="shapeDragEnd1">
<GanttChartWithTable id="GanttChartWithTable2" shapeDragEnd="shapeDragEnd2">
Here, shapeDragEnd1 event is triggered when the shape is dropped on 1st chart while shapeDragEnd2 event is triggered when the shape is dropped on 2nd chart.
CONTROLLER.JS :
Inside the controller we will now write the code to implement these 2 functions in addition to the previous code.
Also, don't forget to create data and shape for the second chart.
First we'll understand the code of shapeDragEnd1 function :

First of all when we drag the shape from 2nd to 1st chart, this 'shapeDragEnd1' event gets triggered. So we will read the source and target of the event. An if condition if added to rule out the condition if the user drags and drops into the same chart. After this we need to add the dragged order data into the model of first chart and remove the same from the model of the second chart.
var data = this.oGanttChartWithTable2.getSelectedShapes().order[0].objectInfoRef.data;
This variable 'data' holds the data of the selected shape.
While removing we use the variable flag to know the position of the selected data in the model.
Similarly the code of shapeDragEnd2 function :

So this is how we can implement drag and drop in between 2 Gantt charts. You can also refer to the snippix link:
http://veui5infra.dhcp.wdf.sap.corp:8080/snippix/#27984
in this example , you can drag a single order from any chart to the other one.
Note : This snippix is implemented for drag and drop of a single order only. As a further research, you can try implementing it for multiple orders.
Hint : getSelectedShapes() function returns all the selected shapes.
Thanks for reading , hope it helped.
