Hi everyone, this blog is with reference to my previous blog Embedding Google Map on SAP Personas 3.0 ,the POC requirement was to bring the Highest area of sales to lowest area of sales in the Google map with the number denoted on the marker of the map. To use Maps on Personas 2.0 tamas.hoznek has written a great blog on this How to embed Google Maps into a Personas 1.0 / 2.0 flavor? ,Thanks Tamas your blog was an inspiration for me when I got struck while trying to complete this.
I have also focused on the chat feature directly from the Personas Flavor, it is very useful for the speech and hearing impaired persons who is working on SAP Screen Personas. They can directly chat with the admin team, basis team or the person who supports the flavor.
Next is the Google Analytics, on any UI / UX it is important to know how the end user uses the UI for the developers to develop the UI on a most suited way for the end user so by using google analytics we can know exactly how many active users are using the Flavor on the real time, know the rendering time for the flavor, bounce rate and many more data can be gained.
First for bringing Area of sales in Google maps the first thing is we need to get the data from the back-end table, VBAK is the table that contains all the
Sales and Distribution data. Next is to create a ZTABLE which contains the Latitude and Longitude data of the Sold-to-party area.
Creating ZTABLE:
Go to SE11 Transaction and create a table named ZLOCATION
On the fields create three fields as below
Save and activate the Table.
Next, To populate the Table Go to SE37 and execute the Function Module SE16N_INTERFACE and give the I_TAB Parameter as Your table name i.e LOCATION and I_EDIT as X
Now you can enter the data into the table.There are many ways to populate the data i have used one of the methods.
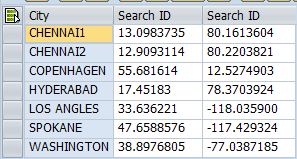
These are the various Sold to party used in the organization.The 2nd Column is the Latitude and the 3rd is the Longitude.
CreatingRFC:
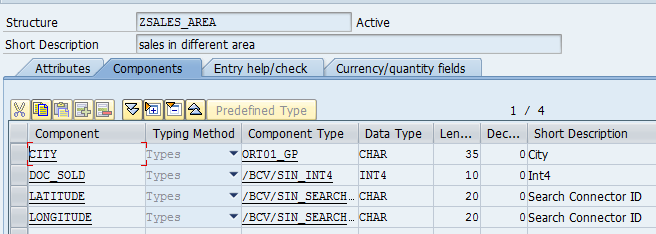
Before creating a RFC create a structure named ZSALES_AREA as below and activate it
Save and activate the structure.
We need the data of which area ranks 1st and which area the next to build the map according to data. For this purpose we are using RFC
Z_SALES_AREA:
Create a RFC and on the tables parameter define a table which can be used as both export and import parameter.
On the Source code Write the logic to calculate the number of times the sold to party has used in the VBAK table
DATA : total
TYPE float,
it_vbak
TYPE TABLE OF vbak,
wa_vbak
TYPE vbak,
it_kna1
TYPE TABLE OF kna1,
wa_kna1
TYPE kna1,
count
TYPE float VALUE 585,
wa_sales_area TYPE zsales_area.
SELECT COUNT( * ) FROM vbak INTO total.
SELECT * FROM vbak INTO CORRESPONDING FIELDS OF TABLE it_vbak.
SELECT * FROM kna1 INTO CORRESPONDING FIELDS OF TABLE it_kna1.
LOOP AT it_kna1 INTO wa_kna1.
LOOP AT it_vbak INTO wa_vbak.
IF wa_kna1-kunnr = wa_vbak-kunnr.
count = count + 1.
ENDIF.
ENDLOOP.
TRANSLATE: wa_kna1-ort01 TO UPPER CASE.
write: wa_kna1-ort01, ' '.
SELECT longitude latitude FROM zlocation INTO CORRESPONDING FIELDS OF wa_sales_area where city = wa_kna1-ort01.
ENDSELECT.
wa_sales_area-city = wa_kna1-ort01.
wa_sales_area-doc_sold = count.
count = 0.
APPEND wa_sales_area TO it_sales_area.
ENDLOOP.
ENDFUNCTION.
Calling this RFC in flavor and building map:
Call the above RFC in the Flavor to get the data.
var rfc = session.createRFC("ZRFC_SALES_AREA");
rfc.requestResults('["IT_SALES_AREA"]');
rfc.send();
var sale = rfc.getResult("IT_SALES_AREA");
var so = JSON.parse(sale);
Write a function to sort the data according to the sales and pass the JSON model to it.
var sort_by = function(field, reverse, primer){
var key = primer ?
function(x) {return primer(x[field])} :
function(x) {return x[field]};
reverse = !reverse ? 1 : -1;
return function (a, b) {
return a = key(a), b = key(b), reverse * ((a > b) - (b > a));
}
}
so.sort(sort_by('DOC_SOLD', true, parseInt));
Next, we have to build the maps using the data fetched in a variable and update the content of the HTML Viewer.
I have attached the file below for building the Map "Gmaps.txt"
Embedding Chat in Flavor.
There are different chats API's available I have used the olark chat Olark live chat. We have to first register and get the site reference key it's for free.
I have embedded it in the Maps HTML Viewer before the </body> tag so that it appears on the bottom right corner of the window.
I have also attached the file for embedding chats in Flavor "Chats.txt"
Using Google Analytics:
Google Analytics also needs to be registered first to get the API Key for using it