
- SAP Community
- Products and Technology
- Supply Chain Management
- SCM Blogs by Members
- Working Together: Collaboration in SAP IBP for sal...
Supply Chain Management Blogs by Members
Learn about SAP SCM software from firsthand experiences of community members. Share your own post and join the conversation about supply chain management.
Turn on suggestions
Auto-suggest helps you quickly narrow down your search results by suggesting possible matches as you type.
Showing results for
steve_rampton2
Explorer
Options
- Subscribe to RSS Feed
- Mark as New
- Mark as Read
- Bookmark
- Subscribe
- Printer Friendly Page
- Report Inappropriate Content
05-19-2016
9:32 AM
As conceived by the Oliver Wight International modern Integrated Business Planning (IBP) means breaking down the functional silos that exist in many enterprises today and truly working together to achieve common objectives. In this article I want to explore why collaborative working is important, the different tools available and the functionality that SAP Integrated Business Planning itself delivers in this area.
What is collaborative working?
The Cambridge Dictionary defines collaborative working as: “the act of two or more people or organizations working together for a particular purpose”. In the context of IBP, the ‘particular purpose’ is the creation of a consensus demand and supply plan that meets the organisation’s financial objectives. IBP may also bring in other organisations that are key stakeholders in the plan such as distributors or suppliers.
Why is collaborative working important?
It may seem obvious and what should probably be the default way of working, but when I started work in the late ‘seventies this was certainly not the case. Departments such as Production Engineering and Finance inhabited very separate worlds, often with little interaction. This often meant that different parts of the same company had separate and very different plans. The board may have defined a strategy for the organisation at the highest level, but each department created their own interpretation of the strategy and how they would execute on it. Typically this will result in an under-performing company, but in extremis the consequences can be much more serious and unfortunately some companies still seem to operate in this way – nearly 40 years later! In an article for the Harvard Business Review in 2012 entitled ‘The Silent Killer of Big Companies’, Boris Groysberg and Michael Slind give some memorable examples of what can happen given a lack of communication in an organisation. One example was how Nokia failed to create clear plans to bring new phones to market and instead held fuzzy deliberations over strategy. The White House commission that studied the Deepwater Horizon tragedy found that ‘poor communications’ and a failure ‘to share important information’ were contributory factors.
On the other hand the increasing pace of innovation, new product introduction and customer led demand are driving the need for ever closer working within organisations and their partner community.
For Integrated Business Planning itself Oliver Wight International define 4 stages of maturity each of which puts a different slant on the requirements for collaborative working:

Figure 1: Stages of IBP Maturity (after Oliver Wight) & Collaboration Needs
What are the different ways of supporting collaborative working?
In the mid-eighties I moved to Lucas Systems & Engineering and worked for the late and great Professor John Parnaby. As well as pioneering the use of many Japanese techniques such as Kanban and QFD, we introduced the Single-Office concept to Lucas’s factories. In essence it tries to create an owner managed small business within a larger organisation. At its core is the belief that small, tight knit teams working closely together are more effective and flexible. Well in those days the Personal Computer had only just arrived and we were still piloting their use on the shop floor. So the only way of achieving the ‘Single-Office’ was by physically moving people into the same open office – itself a novelty to many. For probably the first time staff from different departments discussed issues together, informally over their desks rather than by the infamous Internal Memo: a seemingly innocent instrument that could and was used by many as an organisational first strike nuclear weapon!
Nowadays we do have alternative means of encouraging and supporting collaboration in the workplace. These range from document stores, through instant messaging to social media. In the next section I will show the features that SAP IBP has to support collaboration between the various stakeholders.
Collaboration in SAP IBP
SAP IBP has several different functionalities that support collaborative working to define and review plans and solve issues. In this blog I will only cover those aimed at IBP for sales and operations, there are however other functionalities such as the Custom Alert, Case and Task management intended for Control Tower and I aim to cover these in a subsequent blog.
For IBP for sales and operations there are several functions supporting collaboration and I will start with the main ones of SAP Jam and IBP Process template. After that I will touch on the sharing of Excel views and Analytic Charts and the use of Scenarios for what-if analyses.
SAP Jam and the IBP Process
There are two main elements to the support for collaborative working in IBP for sales and operations that are actually closely coupled. SAP Jam is best seen as social media for the enterprise, and was a product SAP acquired when they bought SuccessFactors. This is closely linked to a mechanism which allows users to represent the steps of an IBP or S&OP cycle and their status. Let’s look at SAP Jam in more detail first.
Jam is a clean, easy to use product that I can attest is also very heavily used within SAP itself including to collaborate with partners and customers on specific topics. Although customers have to licence SAP Jam separately to IBP the two products are tightly coupled. Like IBP and HCI, Jam is run in the cloud so there is no installation required at the customer side. There is also a trust relationship defined between Jam and IBP so once the link between a user’s IBP and Jam accounts is defined they can access Jam directly from IBP without logging in again. In fact the Jam screens are displayed within the IBP WebUI main frame itself. Jam has the concepts of Groups which are somewhat analogous to Facebook ‘pages’ for a group. In IBP it is envisaged that each IBP review step would have its own group. Some of the key features of groups are listed below:

Figure 2 shows an example of the Overview page for a Jam group for the Executive Review step of a company and which illustrates some of the features listed above.
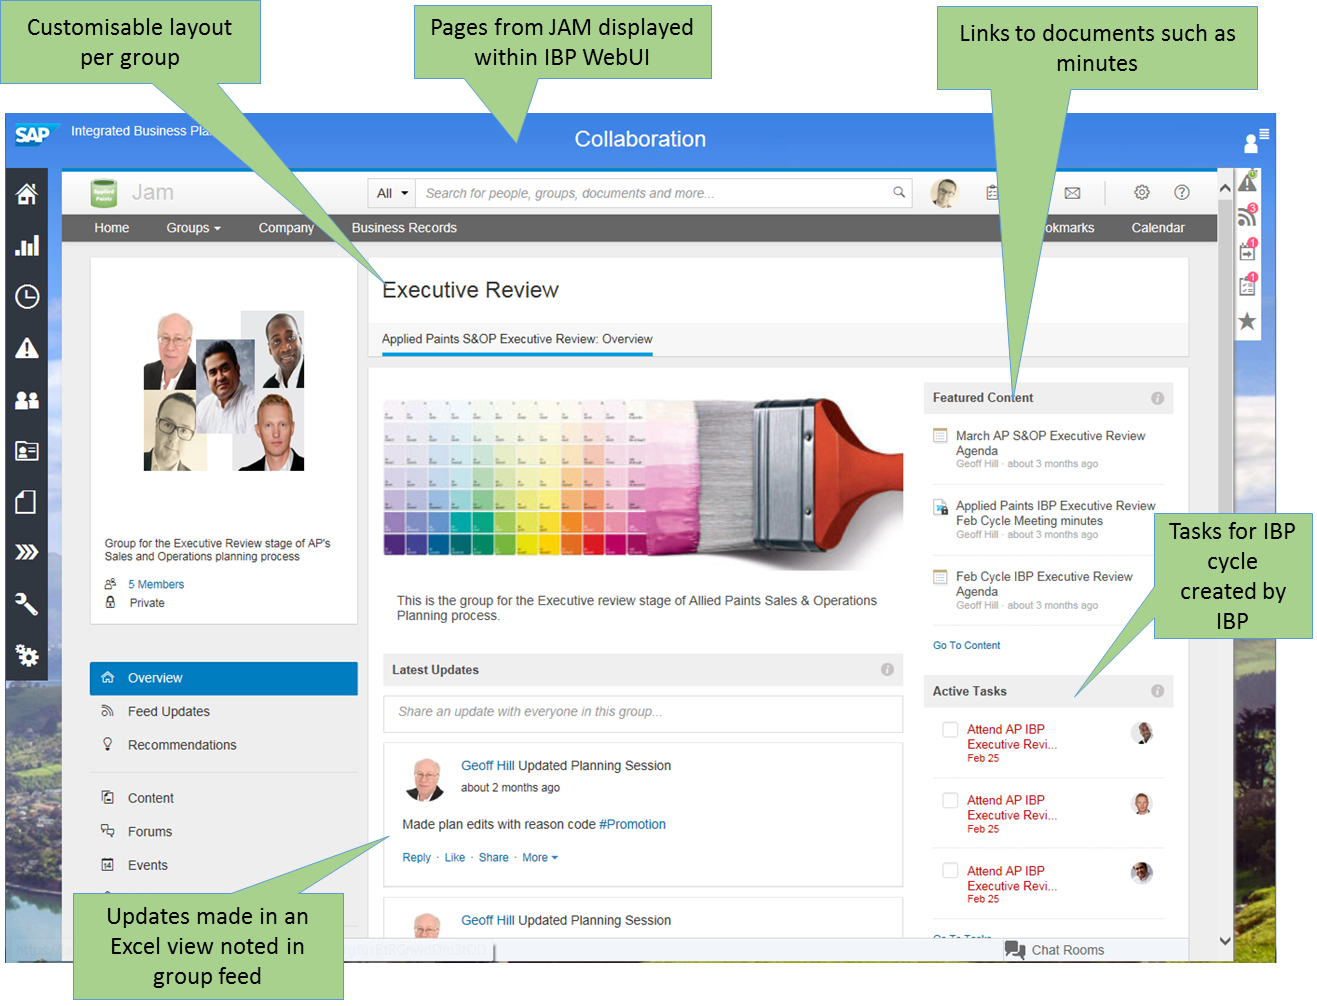
Figure 2: An example Jam Group for the Executive Review IBP Step
An IBP or S&OP cycle normally consists of a sequence of steps or reviews. Typically these start with a Product Review to look at new and withdrawn products, then Sales and Demand Reviews to define the demand plan, followed by a Supply Review to see how the demand can be met profitably and culminating in Consensus and Executive Reviews where issues are raised and resolved. In most cases a complete cycle runs over a month but there are companies that have weekly S&OP cycles.
There are a couple of important points about the process and steps:
- Different companies use different names for steps – Management Business Review instead of Executive Review for example.
- Some steps may be omitted or combined if it makes sense.
- One company may have several independent processes for different business units or geographical parts of the company that run in parallel.
- There can be special processes – for example an annual budget cycle.
The process and its individual steps are defined in IBP as planning process templates and each cycle created as an instance of a template. The above explains why SAP have chosen not to pre-define the steps and their names but to allow customers to define their own and to have multiple templates.

Figure 3: An Example IBP Process Instance
Figure 3 is an example of a process instance for a company. In this case the earlier steps of Product, Demand and Supply Reviews have already been completed. The Consensus review has just begun and the final Executive Review is still to start. What may not be obvious from the figure is:
- Each step is linked to a Jam group and the user can access the group directly if they click on the step title.
- There is a defined duration and start day (relative to the process start) for a step.
- A step has an owner and a list of participants – the latter being derived via an authorisation role for simplicity of maintenance.
- When a step is put into progress a task is created automatically in Jam for each participant which they can use to indicate their completion of their activities for the cycle. As each person completes their task the progress bar is updated to reflect the number of completed tasks.
- By clicking on the ‘i’ in the bottom left of each step you can see the detail of the participants, process and step owners as well as the due date and linked Jam group.
As each participant reviews and makes their inputs to the plan, whether in the form of adjustments, direct inputs or running planning jobs IBP will prompt them to pick one or more reason codes from a customer defined list, give some explanatory text and choose which of the Jam groups they would like to post it to.

Figure 4: Sharing the rationale for changes
You can see from Figure 4 that an account manager has made an adjustment to the Sales forecast based on some information received from customer C&R. He gives it a reason code of ‘Customer Input’ and posts it to the Demand Review Jam group as can be seen in Figure 5. Note how the reason code has come across as a hash tag. You can click on the hash tags to get a list of all posts with the same tag.

Figure 5: Posting made to Demand Review Jam Group
It is also worth pointing out that you don’t need to go into Jam to see the Feed for groups. If you click the icon (I’ll call it a ‘loudspeaker’ icon) that is circled in Figure 6 the screen will changed to display the feed as a list to the left. You can choose which Jam groups are shown and can also post directly to chosen group.

Figure 6: Jam feed displayed in IBP
Sharing Excel Views
One key enabler of collaborative working is to be able to share information. In the planning world how many of us have seen large, complex spreadsheets shared around the team by email or stored on document sharing sites? This has good and bad aspects. One key, and good, aspect is that the information is available to the team in a form that is understood and familiar to all. However on the negative side generally all the information has to be stored in the spreadsheet at once, making it unwieldy and hard to limit visibility for segregation of duties etc. Also I’m sure we’ve all had such spreadsheets corrupted inadvertently by a colleague.
To a significant extent SAP IBP allows us to get the best of both worlds. A team leader or power user can define a workbook with one or multiple views to best suit their teams’ requirements and then share this workbook with other members of their team. They can decide who to share with by individual or to reduce further maintenance by role. Figure 7 below shows an example where a Sales Input view is being shared with other members of the sales and sales management teams. Subsequent changes to the view will become visible to the other members and the workbook is stored in the IBP system itself. The data itself doesn't have to be stored in the workbook: it is fetched from IBP when the user opens or refreshes it and only returns data they are authorised to see.

Figure 7: Sharing an Excel View from Favourites
Of course it is still possible for the owner of the view to corrupt it. Therefore I strongly recommended that people keep a backup copy of the workbook somewhere safe!
An Excel workbook containing IBP views is still at the end of the day just a spreadsheet and it is still possible to share them with others by email. The recipient can open them as usual and if they logon to IBP refresh the data and store to their own favourites. However the connection to the original workbook is lost.
Sharing Analytics
In SAP IBP Analytic charts and Dashboards are very user centric. They are designed to be created by users and are owned by their creator. When I say owned I mean completely: no-one else can edit or delete them. So if you are creating analytics as part of a project take care which user you do it under and don’t, under any circumstances, delete it!
However despite this it is possible for analytics to be shared. In a similar fashion to Views a user can share a chart or dashboard by user id or role – see Figure 8 as an example. There are global parameters that makes charts and dashboards public by default but this is unlikely to be something you want and also clutters up users Webui screens.

Figure 8: Sharing a Chart in IBP
A chart is recognised as a picture in Explorer so you can also save it as a picture or email it to colleagues. Simply do a right-mouse click and pick the option you want from the context menu.
Scenarios
A key differentiator of IBP from other products is the ability to perform what-ifs, quickly and easily. This was always a wish from APO that was never fulfilled. The work involved in copying data to a new version was simply too laborious.
IBP has two functionalities that are key to making what-if’s real:
Scenarios: User created subset of the data to which changes can be made and the results of the changes calculated. Note however that scenarios and their data are not visible in Analytics.
Sharing scenarios: When a scenario is created the creator can decide who else can see and work with it. This allows multiple people to collaborate on different aspects such as demand changes and supply plans.
Comparing scenarios: It isn't much use if you cannot compare the results of the scenario with the original plan. In IBP Excel views you can display key figure data for multiple scenarios at the same time and use local members to calculate the differences as in Figure 9 below.
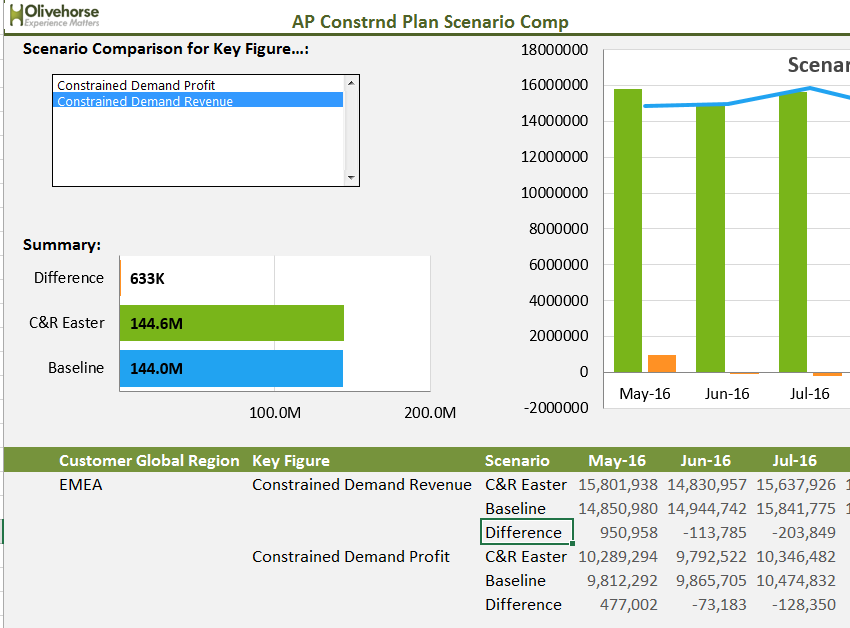
Figure 9: Scenario comparison view
What more is required?
As always no product is perfect and there are some functions that I would love to see in IBP:
- We have a close coupling between IBP and SAP Jam and yet no-way to directly post a snapshot of a chart or part of an Excel view to a Jam group feed or content. It would allow planners to include the evidence for discussion of an issue or help document a plan review.
- There is no way currently to add notes to changes that are then visible in the view itself linked to the context in terms of key figure and time bucket changed along with the attribute level used. Such notes are helpful to allow multiple people collaborating on defining the same data to explain their rationale. They are unlikely to search through the Jam Feed to check!
If you have any questions then please drop me a line.
- SAP Managed Tags:
- SAP Integrated Business Planning for Supply Chain
1 Comment
You must be a registered user to add a comment. If you've already registered, sign in. Otherwise, register and sign in.
Labels in this area
-
aATP
1 -
ABAP Programming
1 -
Activate Credit Management Basic Steps
1 -
Adverse media monitoring
1 -
Alerts
1 -
Ausnahmehandling
1 -
bank statements
1 -
Bin Sorting sequence deletion
1 -
Bin Sorting upload
1 -
BP NUMBER RANGE
1 -
Brazil
1 -
Business partner creation failed for organizational unit
1 -
Business Technology Platform
1 -
Central Purchasing
1 -
Charge Calculation
2 -
Cloud Extensibility
1 -
Compliance
1 -
Controlling
1 -
Controlling Area
1 -
Data Enrichment
1 -
DIGITAL MANUFACTURING
1 -
digital transformation
1 -
Dimensional Weight
1 -
Direct Outbound Delivery
1 -
E-Mail
1 -
ETA
1 -
EWM
6 -
EWM - Delivery Processing
2 -
EWM - Goods Movement
4 -
EWM Outbound configuration
1 -
EWM-RF
1 -
EWM-TM-Integration
1 -
Extended Warehouse Management (EWM)
3 -
Extended Warehouse Management(EWM)
7 -
Finance
1 -
Freight Settlement
1 -
Geo-coordinates
1 -
Geo-routing
1 -
Geocoding
1 -
Geographic Information System
1 -
GIS
1 -
Goods Issue
2 -
GTT
2 -
IBP inventory optimization
1 -
inbound delivery printing
1 -
Incoterm
1 -
Innovation
1 -
Inspection lot
1 -
intraday
1 -
Introduction
1 -
Inventory Management
1 -
Localization
1 -
Logistics Optimization
1 -
Map Integration
1 -
Material Management
1 -
Materials Management
1 -
MFS
1 -
New Feature
1 -
Outbound with LOSC and POSC
1 -
Packaging
1 -
PPF
1 -
PPOCE
1 -
PPOME
1 -
print profile
1 -
Process Controllers
1 -
Production process
1 -
QM
1 -
QM in procurement
1 -
Real-time Geopositioning
1 -
Risk management
1 -
S4 HANA
1 -
S4 HANA 2022
1 -
S4-FSCM-Custom Credit Check Rule and Custom Credit Check Step
1 -
S4SCSD
1 -
Sales and Distribution
1 -
SAP DMC
1 -
SAP ERP
1 -
SAP Extended Warehouse Management
2 -
SAP Hana Spatial Services
1 -
SAP IBP IO
1 -
SAP MM
1 -
sap production planning
1 -
SAP QM
1 -
SAP REM
1 -
SAP repetiative
1 -
SAP S4HANA
1 -
SAP TM
1 -
SAP Transportation Management
3 -
SAP Variant configuration (LO-VC)
1 -
SD (Sales and Distribution)
1 -
Source inspection
1 -
Storage bin Capacity
1 -
Supply Chain
1 -
Supply Chain Disruption
1 -
Supply Chain for Secondary Distribution
1 -
Technology Updates
1 -
TMS
1 -
Transportation Cockpit
1 -
Transportation Management
2 -
Visibility
2 -
warehouse door
1 -
WOCR
1
- « Previous
- Next »
Related Content
- SAP Business Network for Logistics 2404 Release – What’s New? in Supply Chain Management Blogs by SAP
- SAP Named a Leader in the 2024 Gartner Magic Quadrant for Transportation Management Systems in Supply Chain Management Blogs by SAP
- SAP IBP Real-Time Integration: Empowering Businesses for Smarter, Faster Decisions in Supply Chain Management Blogs by SAP
- Preferred Alternative UoM for Warehouse Operation in EWM in Supply Chain Management Blogs by Members
- Adverse Media Monitoring: How to improve overall Supply Chain Management in Supply Chain Management Blogs by Members
Top kudoed authors
| User | Count |
|---|---|
| 4 | |
| 4 | |
| 3 | |
| 2 | |
| 2 | |
| 2 | |
| 1 | |
| 1 | |
| 1 | |
| 1 |