Analysis Path Framework (APF) is a framework which provides reuse components that allow you to build and enhance interactive analytical Web applications. Recently during my self study, I find out that an OData service exposed by CDS view could easily be consumed by APF.
Here below is detailed step.
For prerequisites to use APF, you can find it in SAP help.
In my case, I have the following PFCG role assigned:

And this role has the following role menu assigned:

Step1. Create a simple header and item CDS view, and a consumption view to expose as OData service.
Below source code is for item view:
@AbapCatalog.sqlViewName: 'zorITem'

@AbapCatalog.compiler.compareFilter: true

@AccessControl.authorizationCheck: #CHECK

@EndUserText.label: 'order item detail'

define view Z_I_Order_Item as select from zorder_item {

  key zorder_item.parent_id,

  key zorder_item.item_id,

  zorder_item.item_text

}

Below source code for header view:

@AbapCatalog.sqlViewName: 'zorheader'

@AbapCatalog.compiler.compareFilter: true

@AccessControl.authorizationCheck: #CHECK

@EndUserText.label: 'header view'

define view Z_I_Order_Header as select from zorder_header

association [0..*] to Z_I_Order_Item as _Item

on $projection.object_id = _Item.parent_id

{

  key zorder_header.object_id,

  zorder_header.description,

  @ObjectModel.association.type: #TO_COMPOSITION_CHILD

  _Item

}
The corresponding database in ABAP for these two CDS views are listed below:
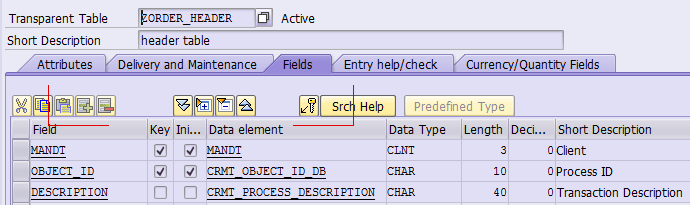

The source code of CDS view:
@AbapCatalog.sqlViewName: 'zjorderview'

@AbapCatalog.compiler.compareFilter: true

@AccessControl.authorizationCheck: #CHECK

@EndUserText.label: 'Jerry order consumption view'

@OData.publish: true

define view Z_C_Order as select from Z_I_Order_Header {

  key Z_I_Order_Header.object_id,

  Z_I_Order_Header.description,

  @ObjectModel.association.type: [#TO_COMPOSITION_CHILD]

  Z_I_Order_Header._Item

}
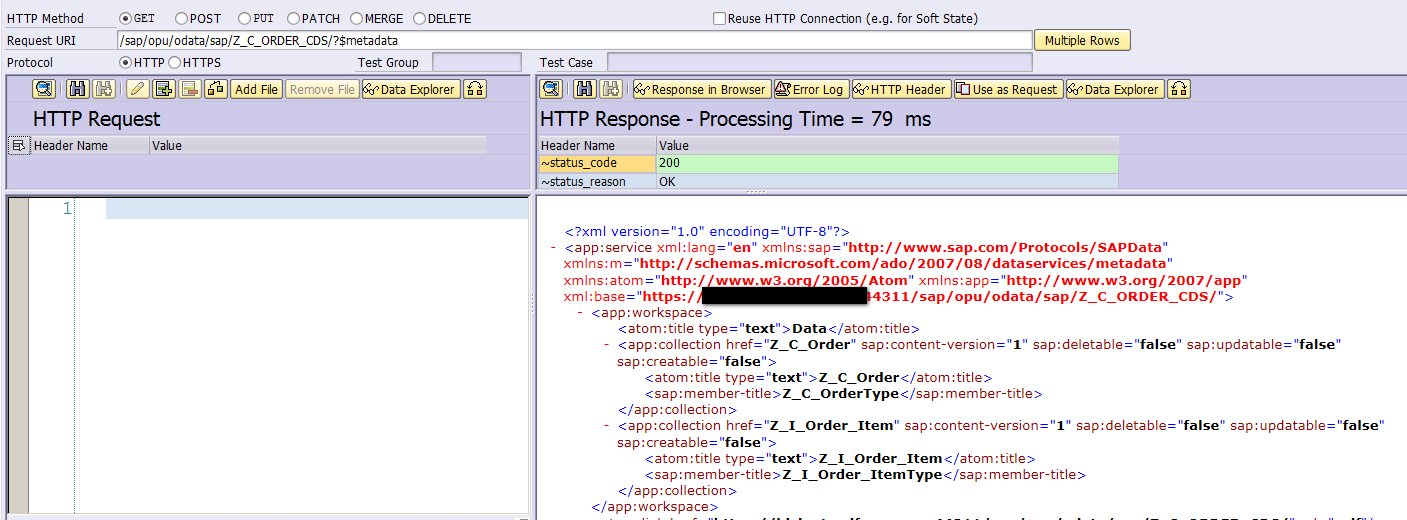
Since I use the annotation OData.publish:true, so a corresponding OData service Z_C_Order_CDS is generated automatically.
Register it via tcode /IWFND/MAINT_SERVICE. Once done, ensure the metadata access could successfully be done.
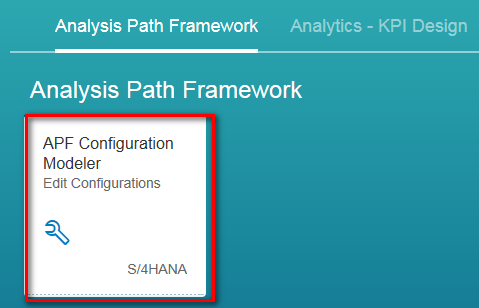
Step2. Expose the created OData service via APF
Click tile APF Configuration Modeler,
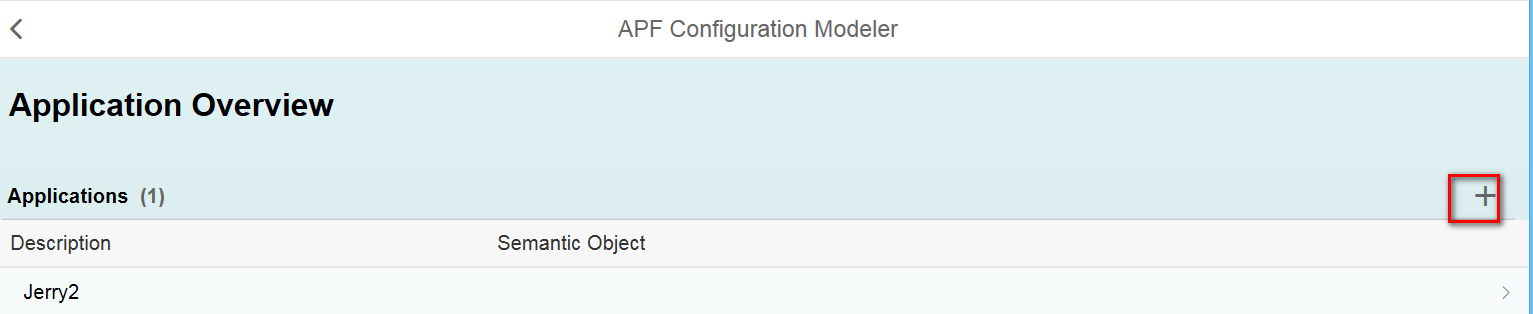
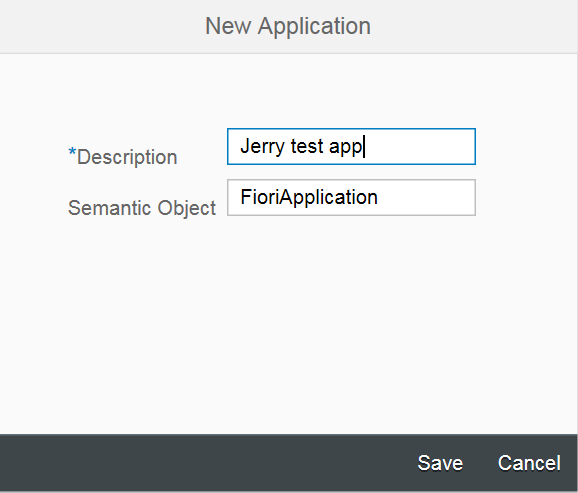
Create a new Application:
Use the default semantic object:
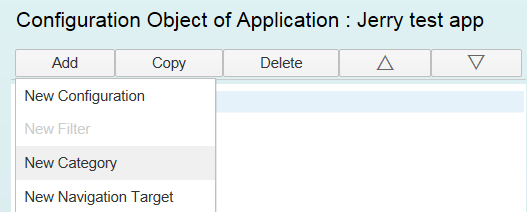
Create a new configuration which acts as a container for sub settings such as Filters and Categories:

In Smart Filter, choose the OData service and entity type created from previous step.

And a new category:

Select this new category and create a new step:

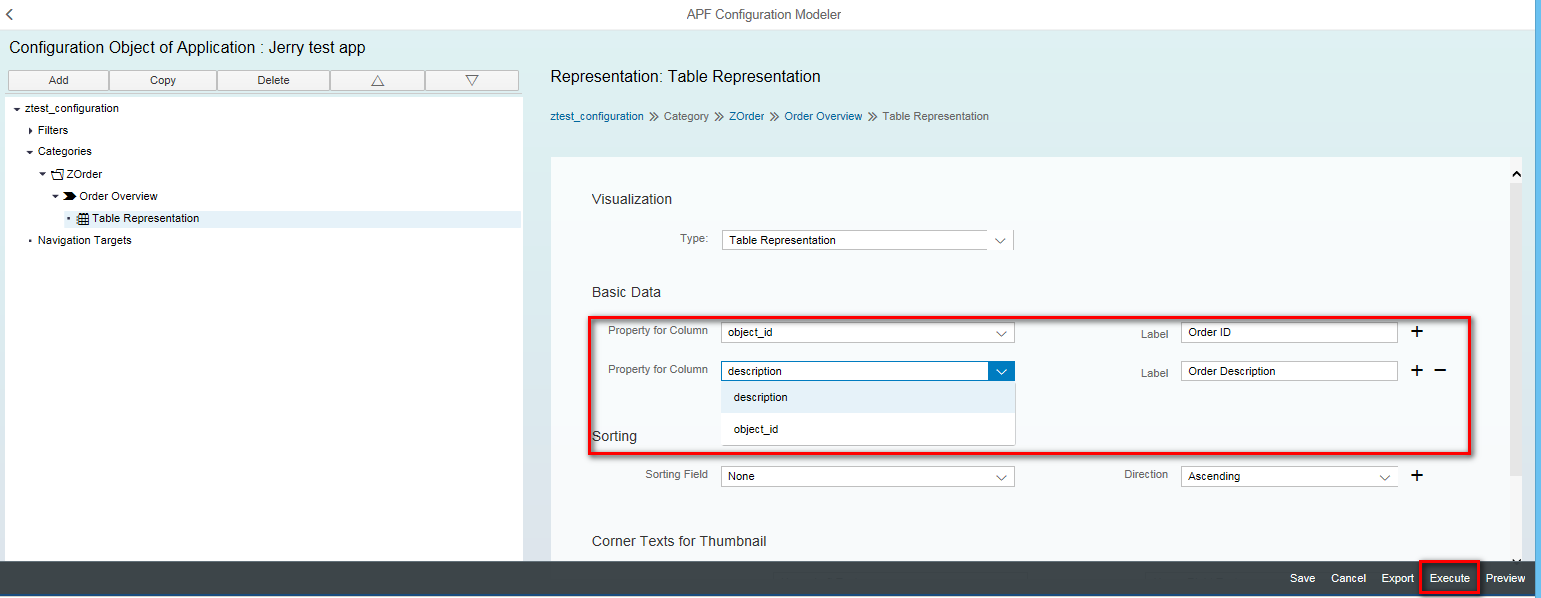
In the step creation page, just select all the two properties exposed by CDS view Z_C_Order, that is:

Create a new Representation based on this step:

Here for representation type, I just choose the most simple one: Table. Choose property from drop down list for table display.
Once done, click execute button, you will see the following screen:


Then choose the table representation:

Then the table is displayed as expected:

Its content matches with the data in the corresponding database table.

