
- SAP Community
- Groups
- Interest Groups
- Application Development
- Blog Posts
- Load Testing with JMeter: Test Results Visualizati...
Application Development Blog Posts
Learn and share on deeper, cross technology development topics such as integration and connectivity, automation, cloud extensibility, developing at scale, and security.
Turn on suggestions
Auto-suggest helps you quickly narrow down your search results by suggesting possible matches as you type.
Showing results for
vadimklimov
Active Contributor
Options
- Subscribe to RSS Feed
- Mark as New
- Mark as Read
- Bookmark
- Subscribe
- Printer Friendly Page
- Report Inappropriate Content
04-06-2016
4:46 PM
Update on 24.06.2017
The listener plugin has been re-implemented in order to reduce number of external dependencies that are not contained in JMeter distribution and require additional libraries: HTTP client was changed from Jersey to Elasticsearch Java REST (external dependency), JSON processor was changed from Gson to json-smart (contained in JMeter distribution).
Additional listener configuration parameter has been introduced to allow exclusion of specific attributes of sample result from being sent to Elasticsearch server.
Apache JMeter (Apache JMeter - Apache JMeter™) is one of popular tools for load testing, which became a "Swiss Army knife" in the area of integration scenarios performance testing. It is open source, lightweight, supports variety of load generator types (called samplers in JMeter's terminology), and it is flexibly extendible. Most commonly extension plugins are developed for samplers - so that JMeter can be used to generate load for specific technologies and protocols. But there is another area, which is worth of paying attention to - processing, presentation and visualization of test results. In JMeter, listener components are responsible for this task. JMeter is already equipped with some of them, 3rd party plugins enrich listeners capabilities by bringing new listeners - but in majority of cases, listeners are either visualizing test results in JMeter, or exporting them to external files. Test results visualization in JMeter is limited to user interface technologies used by JMeter, export to external files requires further data processing and rendering.
For those who would like to familiarize themselves with JMeter, there are technical materials describing its basic concepts, development and usage of test plans and their major components: a good starting point is documentation published on JMeter's official web site, complemented by examples of JMeter test plans, which can be found over the Internet and on SCN.
In this blog, I would like to describe an alternative approach, which employs external data visualization tools for presentation of test results obtained from JMeter test plan executions in real time. I will use Kibana (Kibana: Explore, Visualize, Discover Data | Elastic), which is a part of ELK stack, but generally speaking, the approach can be easily adopted and other data visualization / dashboard tools can be utilized instead. In conjunction with Kibana, which is used for data visualization, I will utilize Elasticsearch for storing and indexing JMeter test results data (samples data). Principal flow diagram depicting involved components, is provided in the illustration below:

Custom developed JMeter listener for Elasticsearch sends test results data to an Elasticsearch server, Kibana uses indexed data persisted in Elasticsearch, when visualizing it in a prepared dashboard.
A developed JMeter listener for Elasticsearch is bundled as a JAR file. A Java class implementing listener, has to extend JMeter's abstract class AbstractBackendListenerClient. Details on AbstractBackendListenerClient are provided in JavaDocs for JMeter and can be found at https://jmeter.apache.org/api/index.html?org/apache/jmeter/visualizers/backend/AbstractBackendListen.... Below are some key points regarding important methods of this class, that have to be implemented by custom listeners:
Following 3rd party libraries that are not contained in JMeter distribution, where used in implementation of a listener for Elasticsearch:
Other dependency libraries that are used in this listener, shall already be contained in JMeter distribution.
At least JRE 8 is required to use it.
Additionally, generation of a Java class reflecting structure of test results / sample data was done using http://www.jsonschema2pojo.org/.
Utility and dependency libraries (Elasticsearch Java REST client) shall be placed in directory <JMeter home>/lib.JMeter listener plugin binary shall be placed in directory <JMeter home>/lib/ext.
Source code of the developed listener, as well as compiled and built plugin (which is distributed as a JAR file) can be downloaded from GitHub.
The developed listener has been tested with JMeter version 3.2 running on Java 1.8 runtime.
I have prepared a JMeter test plan that consists of two samplers, which are responsible for generation of SOAP requests (being sent to a SAP PO system to trigger a simple interface) and HTTP requests (being sent to a public Internet service for retrieving current time).
Below is a screenshot of main components of a test plan and configuration of a developed listener for Elasticsearch. As it can be noticed, custom listener is added to a test plan using component Backend Listener and selecting a class that implements the required listener:

Later on, the parameter 'result.attributes.excluded' has been introduced and can be used to specify sample result attributes that do not need to be passed to Elasticsearch server. Names of attributes shall be comma-delimited. Full list of currently collected and available attributes, is: Timestamp, StartTime, EndTime, Time, Latency, ConnectTime, IdleTime, SampleLabel, GroupName, ThreadName, ResponseCode, IsResponseCodeOk, IsSuccessful, SampleCount, ErrorCount, ContentType, MediaType, DataType, RequestHeaders, ResponseHeaders, HeadersSize, SamplerData, ResponseMessage, ResponseData, BodySize, Bytes.
The test plan configuration implies execution of samplers several times - having done so, we are capable of collecting some volume of test data, that is sufficient for visualization demonstration in Kibana.
The developed listener produces log entries that can be accessed from JMeter - info / error messages for major events and debug messages in case details of listener execution need to be collected:

Configuration of Elasticsearch and Kibana, as well as development of visualizations and dashboards in Kibana are out of scope of this blog. Please refer to official documentation available on Elastic web site and tutorials published in Internet in case details are required in regards to these topics.
Let us now start test plan execution in JMeter and simulate both successful and failed sample executions in one of target systems. Below is an outlook at results visualized in a Kibana dashboard: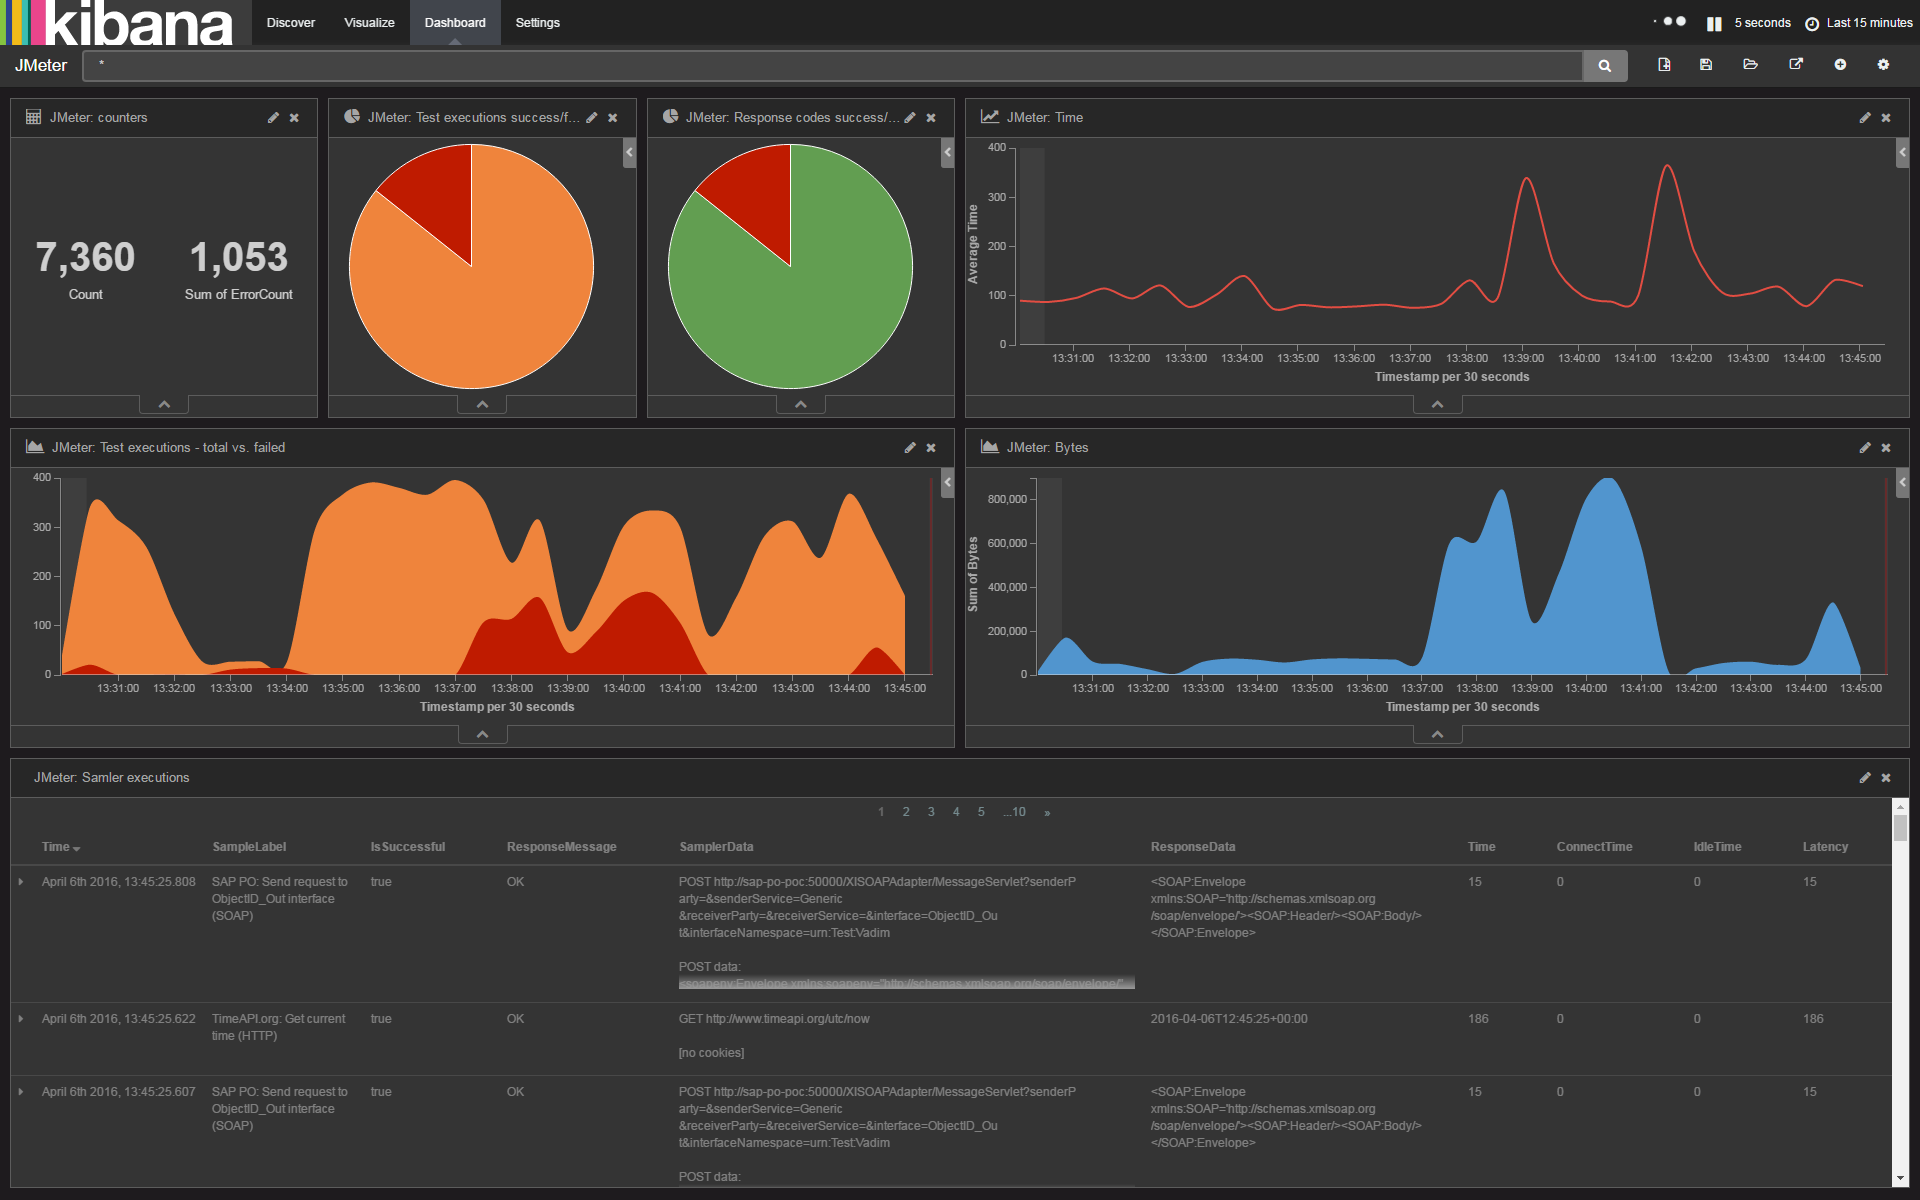
It shall be noted that just few attributes of retrieved test results were visualized and used in a demonstrated Kibana dashboard - there is much more data sent by a listener and indexed by Elasticsearch, which can be used for more precise analysis of test results. Below is a sample indexed document (test sample) containing various metrics and test sample request / response data, which were submitted by JMeter, persisted in Elasticsearch and available for visualization in Kibana:
The listener plugin has been re-implemented in order to reduce number of external dependencies that are not contained in JMeter distribution and require additional libraries: HTTP client was changed from Jersey to Elasticsearch Java REST (external dependency), JSON processor was changed from Gson to json-smart (contained in JMeter distribution).
Additional listener configuration parameter has been introduced to allow exclusion of specific attributes of sample result from being sent to Elasticsearch server.
Intro
Apache JMeter (Apache JMeter - Apache JMeter&trade;) is one of popular tools for load testing, which became a "Swiss Army knife" in the area of integration scenarios performance testing. It is open source, lightweight, supports variety of load generator types (called samplers in JMeter's terminology), and it is flexibly extendible. Most commonly extension plugins are developed for samplers - so that JMeter can be used to generate load for specific technologies and protocols. But there is another area, which is worth of paying attention to - processing, presentation and visualization of test results. In JMeter, listener components are responsible for this task. JMeter is already equipped with some of them, 3rd party plugins enrich listeners capabilities by bringing new listeners - but in majority of cases, listeners are either visualizing test results in JMeter, or exporting them to external files. Test results visualization in JMeter is limited to user interface technologies used by JMeter, export to external files requires further data processing and rendering.
For those who would like to familiarize themselves with JMeter, there are technical materials describing its basic concepts, development and usage of test plans and their major components: a good starting point is documentation published on JMeter's official web site, complemented by examples of JMeter test plans, which can be found over the Internet and on SCN.
In this blog, I would like to describe an alternative approach, which employs external data visualization tools for presentation of test results obtained from JMeter test plan executions in real time. I will use Kibana (Kibana: Explore, Visualize, Discover Data | Elastic), which is a part of ELK stack, but generally speaking, the approach can be easily adopted and other data visualization / dashboard tools can be utilized instead. In conjunction with Kibana, which is used for data visualization, I will utilize Elasticsearch for storing and indexing JMeter test results data (samples data). Principal flow diagram depicting involved components, is provided in the illustration below:
Custom developed JMeter listener for Elasticsearch sends test results data to an Elasticsearch server, Kibana uses indexed data persisted in Elasticsearch, when visualizing it in a prepared dashboard.
JMeter Listener for Elasticsearch
A developed JMeter listener for Elasticsearch is bundled as a JAR file. A Java class implementing listener, has to extend JMeter's abstract class AbstractBackendListenerClient. Details on AbstractBackendListenerClient are provided in JavaDocs for JMeter and can be found at https://jmeter.apache.org/api/index.html?org/apache/jmeter/visualizers/backend/AbstractBackendListen.... Below are some key points regarding important methods of this class, that have to be implemented by custom listeners:
- getDefaultParameters(). Implements logic to set parameters and their default values. It is necessary to specify parameters programmatically so that they appear on the UI of the listener, default values can be overwritten later in JMeter in the listener UI. In the developed listener, parameters are used to specify connectivity and authentication configuration for a called Elastichsearch server, index to be used and timezone to be used for timestamps adjustment (if necessary);
- setupTest(). Implements initialization logic. Called once at the beginning of an executed test plan. In the developed listener, an Elasticsearch server ping test is conducted during initialization - if ping fails (for example, due to network connectivity issues between JMeter and an Elasticsearch server, an Elasticsearch server being down or incorrectly specified listener parameters), listener will not attempt to send samples data to an Elasticsearch server;
- teardownTest(). Implements cleanup logic. Called once at the end of an executed test plan. Not used in the developed listener;
- handleSampleResults(). Implements listener logic that is used to handle and process each sampler execution results. Called at each iteration of the test for each thread in the thread group. In the developed listener, sample data is marshalled into JSON format and sent to a specified Elasticsearch server by invoking its corresponding REST API over HTTP(S).
Following 3rd party libraries that are not contained in JMeter distribution, where used in implementation of a listener for Elasticsearch:
- Elasticsearch Java REST client library. Used to generate and send requests to Elasticsearch server using its API.
Other dependency libraries that are used in this listener, shall already be contained in JMeter distribution.
At least JRE 8 is required to use it.
Additionally, generation of a Java class reflecting structure of test results / sample data was done using http://www.jsonschema2pojo.org/.
Utility and dependency libraries (Elasticsearch Java REST client) shall be placed in directory <JMeter home>/lib.JMeter listener plugin binary shall be placed in directory <JMeter home>/lib/ext.
Source code of the developed listener, as well as compiled and built plugin (which is distributed as a JAR file) can be downloaded from GitHub.
The developed listener has been tested with JMeter version 3.2 running on Java 1.8 runtime.
Demo
I have prepared a JMeter test plan that consists of two samplers, which are responsible for generation of SOAP requests (being sent to a SAP PO system to trigger a simple interface) and HTTP requests (being sent to a public Internet service for retrieving current time).
Below is a screenshot of main components of a test plan and configuration of a developed listener for Elasticsearch. As it can be noticed, custom listener is added to a test plan using component Backend Listener and selecting a class that implements the required listener:
Later on, the parameter 'result.attributes.excluded' has been introduced and can be used to specify sample result attributes that do not need to be passed to Elasticsearch server. Names of attributes shall be comma-delimited. Full list of currently collected and available attributes, is: Timestamp, StartTime, EndTime, Time, Latency, ConnectTime, IdleTime, SampleLabel, GroupName, ThreadName, ResponseCode, IsResponseCodeOk, IsSuccessful, SampleCount, ErrorCount, ContentType, MediaType, DataType, RequestHeaders, ResponseHeaders, HeadersSize, SamplerData, ResponseMessage, ResponseData, BodySize, Bytes.
The test plan configuration implies execution of samplers several times - having done so, we are capable of collecting some volume of test data, that is sufficient for visualization demonstration in Kibana.
The developed listener produces log entries that can be accessed from JMeter - info / error messages for major events and debug messages in case details of listener execution need to be collected:
Configuration of Elasticsearch and Kibana, as well as development of visualizations and dashboards in Kibana are out of scope of this blog. Please refer to official documentation available on Elastic web site and tutorials published in Internet in case details are required in regards to these topics.
Let us now start test plan execution in JMeter and simulate both successful and failed sample executions in one of target systems. Below is an outlook at results visualized in a Kibana dashboard:
It shall be noted that just few attributes of retrieved test results were visualized and used in a demonstrated Kibana dashboard - there is much more data sent by a listener and indexed by Elasticsearch, which can be used for more precise analysis of test results. Below is a sample indexed document (test sample) containing various metrics and test sample request / response data, which were submitted by JMeter, persisted in Elasticsearch and available for visualization in Kibana:
- SAP Managed Tags:
- Java
35 Comments
You must be a registered user to add a comment. If you've already registered, sign in. Otherwise, register and sign in.
Labels in this area
-
A Dynamic Memory Allocation Tool
1 -
ABAP
8 -
abap cds
1 -
ABAP CDS Views
14 -
ABAP class
1 -
ABAP Cloud
1 -
ABAP Development
4 -
ABAP in Eclipse
1 -
ABAP Keyword Documentation
2 -
ABAP OOABAP
2 -
ABAP Programming
1 -
abap technical
1 -
ABAP test cockpit
7 -
ABAP test cokpit
1 -
ADT
1 -
Advanced Event Mesh
1 -
AEM
1 -
AI
1 -
API and Integration
1 -
APIs
8 -
APIs ABAP
1 -
App Dev and Integration
1 -
Application Development
2 -
application job
1 -
archivelinks
1 -
Automation
3 -
BTP
1 -
CAP
1 -
CAPM
1 -
Career Development
3 -
CL_GUI_FRONTEND_SERVICES
1 -
CL_SALV_TABLE
1 -
Cloud Extensibility
8 -
Cloud Native
7 -
Cloud Platform Integration
1 -
CloudEvents
2 -
CMIS
1 -
Connection
1 -
container
1 -
Debugging
2 -
Developer extensibility
1 -
Developing at Scale
4 -
DMS
1 -
dynamic logpoints
1 -
Eclipse ADT ABAP Development Tools
1 -
EDA
1 -
Event Mesh
1 -
Expert
1 -
Field Symbols in ABAP
1 -
Fiori
1 -
Fiori App Extension
1 -
Forms & Templates
1 -
IBM watsonx
1 -
Integration & Connectivity
10 -
JavaScripts used by Adobe Forms
1 -
joule
1 -
NodeJS
1 -
ODATA
3 -
OOABAP
3 -
Outbound queue
1 -
Product Updates
1 -
Programming Models
13 -
RFC
1 -
RFFOEDI1
1 -
SAP BAS
1 -
SAP BTP
1 -
SAP Build
1 -
SAP Build apps
1 -
SAP Build CodeJam
1 -
SAP CodeTalk
1 -
SAP Odata
1 -
SAP UI5
1 -
SAP UI5 Custom Library
1 -
SAPEnhancements
1 -
SapMachine
1 -
security
3 -
text editor
1 -
Tools
15 -
User Experience
5
Top kudoed authors
| User | Count |
|---|---|
| 6 | |
| 5 | |
| 3 | |
| 3 | |
| 2 | |
| 2 | |
| 1 | |
| 1 | |
| 1 | |
| 1 |