
- SAP Community
- Products and Technology
- Technology
- Technology Blogs by SAP
- Understanding SAP Performance Statistics for SAP G...
Technology Blogs by SAP
Learn how to extend and personalize SAP applications. Follow the SAP technology blog for insights into SAP BTP, ABAP, SAP Analytics Cloud, SAP HANA, and more.
Turn on suggestions
Auto-suggest helps you quickly narrow down your search results by suggesting possible matches as you type.
Showing results for
Product and Topic Expert
Options
- Subscribe to RSS Feed
- Mark as New
- Mark as Read
- Bookmark
- Subscribe
- Printer Friendly Page
- Report Inappropriate Content
01-28-2016
5:03 PM
When executing an OData service exposed by SAP Gateway, you can easily retrieve the performance statistics by adding a URI parameter.
In this document, I’d like to help to understand the statistic figures by giving some examples for service calls and their performance statistics values.
Table of Contents
1. Preparation
2. Introduction
3. Example 1: common parameters
4. Example 2: rfc overhead
5. Example 3: non gateway times
6. Example 4: bewait and appsum in $batch parallelization
7. Example 5: Parallelization enabled
8. Example 6: Parallelization disabled
9. Example 7: Parallelization customized
10. Summary
11. Links
12. Appendix
12.1. How to enable/disable the $batch parallelization for all services
12.2. How to enable/disable the $batch parallelization for one service
12.3. How to enable performance traces
1. Preparation
In order to follow the descriptions you only need access to a SAP Gateway service and ideally as well access to the Trace Tools and Service Configuration and SPRO.
Most given examples are based on a service which is publicly available at the SAP Gateway Demo System.
If you’re not already registered, you can quickly and easily sign up. Please refer to the following links for more info:
Check also the section about Sample Gateway Services where the service is listed, which is used below
Refer to this document for getting started: Sign up and get started with the SAP Gateway – Demo Consumtion System
See also the Links section below for the links to the documentation of the features used in this document.
2. Introduction
If you append the parameter sap-statistics=true to your service URL, you’ll get a header that contains the performance statistics in your response.
The following screenshot gives an example of such a call and the statistics figures that are provided in the response header:

Note:
Alternatively, instead of adding the URL parameter, you can send the sap-statistics:true as a header
Performance statistic figures are given for the below listed parameters.
The total time that is spend for a service request, can be split into different software components or layers. For each part, the processed time is measured.
Quick reference
| Parameter | Description |
|---|---|
| gwhub | Time spent at Gateway framework on the Hub system |
| gwrfcoh | Time spent on then network (between hub and backend) |
| gwbe | Time spent at Gateway framework in the backend |
| gwapp | Time consumed by implementation of the Gateway service itself |
| gwnongw | Time consumed by components other than SAP Gateway (e.g. RAL, Excel-format) |
| gwappsum | Only in case of batch parallelization: the sum of service implementations in the multiple operations (inside the batch) |
| gwbewait | Only in case of batch parallelization: the Gateway FWK has to wait for e.g. work process or operation to finish |
| fw | The sum of SAP Gateway framework. With other words: fw= gwhub + gwbe + gwrfcoh |
| gwtotal | The sum of SAP Gateway FWK and service implementation: gwtotal=fw+gwapp |
In the following sections, we’ll have a closer look at these statistics parameters.
The examples show how to obtain some values.
The examples are based on sample Gateway services that can be found in the SAP Gateway Demo System.
They are available for public (after registration), which allows you to follow the examples.
3. Example 1
We invoke an entity set of the GWSAMPLE_BASIC service and append the SAP statistics parameter to the URL:
https://sapes4.sapdevcenter.com/sap/opu/odata/IWBEP/GWSAMPLE_BASIC/ProductSet?sap-statistics=true
In my case, I got the following result:
total=224,fw=200,app=24,gwtotal=224,gwhub=108,gwrfcoh=0,gwbe=92,gwapp=24,gwnongw=0
Let's have a closer look atthe parameters:
gwhub
gwhub=108
This parameter provides the time in milliseconds that is spent by the SAP Gateway framework on the SAP Gateway hub system.
For some background information, you may want to check these SCN postings:
Deployment Options in a nutshell
The official documentation can be found at
http://help.sap.com -> Technology Platform -> SAP NetWeaver -> 7.5 -> Function-Oriented View -> SAP Gateway Foundation -> Master Guide -> Deployment Options
gwbe
gwbe=92
This parameter provides the time in milliseconds that is spent by the SAP Gateway framework in the backend system.
The FWK contains convenience implementation and supports the service-developer by providing default behavior.
Only the processing time in the FWK is measured by this parameter. The actual service-implementation is measured separately and the value is given in the gwapp (see below) parameter.
gwapp
gwapp=24
When creating a Gateway service, the main task for the programmer is to implement the so-called dataprovider class.
This class is called by the SAP Gateway framework and it is used to provide the data requested by the user who invoked the service.
Fetching the data can be quite time-consuming, so this time spent is measured separately.
In our current example we're calling the product collection. As such the method GET_ENTITYSET (of the dataprovider class) is invoked by the Gateway FWK and the implementation calls the Enterprise Procurement Model (EPM) to get the list of products. This implementation of the GET_ENTITYSET takes 24 milliseconds.
gwrfcoh
gwrfcoh=0
This parameter indicates how much time is lost on the network. This can be RFC call and/or other network overhead.
In the above given example, both Gateway hub and backend components are installed on the same system, therefore the value for this parameter is 0
fw
fw=200
This is a convenience parameter which indicates the total time spent in the SAP Gateway framework.
It is not measured separately, it is calculated as follows:
fw = gwhub + gwbe + gwrfcoh
In our current example:
fw = 200 = 108 + 92 + 0
gwtotal
gwtotal=224
Again, a convenience parameter.
The value for gwtotal is calculated as follows
gwtotal = fw + gwapp
In the above example:
gwtotal = 224 = 200 + 24
4. Example 2
This example uses a service that gives a value for gwrfcoh.
Again, the service is publicly accessible, if you’re registered on the SAP Gateway Demo system.
In my case, I got the following result:
total=412,fw=343,app=69,gwtotal=412,gwhub=196,gwrfcoh=110,gwbe=37,gwapp=69,gwnongw=0
gwrfcoh
gwrfcoh=110
This parameter represents the time that is spent for the communication between Gateway hub system and Gateway backend system.
We can see that the value counts towards the total framework processing time:
fw = gwhub + gwbe + gwrfcoh
In the above example:
fw = 343 = 196 + 37 + 110
5. Example 3
This example is used to showcase a value for the parameter gwnongw
We're using again the service GWSAMPLE_BASIC
gwnongw
This parameter is described by the official documentation as: “Processing time of applications called (referred to as non SAP Gateway since this processing time is not related to the SAP Gateway framework)”
(see below for the docu-link)
With other words, it is the duration of components that are called by the SAP Gateway framework, but since they aren’t part of SAP Gateway, they are measured separately
Examples are the creation of MS EXCEL or the Read Access Logging (RAL, see Links section below for more info) feature.
About Excel:
Remember that the response payload of a Gateway service can be requested in one of the following formats:
$format=xml
$format=json
$format=xlsx
So in order to get the gwnongw parameter, we can simply append the $format=xlsx parameter to our url:
More info about Excel support in SAP Gateway in the documentation (see also below) and also this question in SCN
Let’s try it out.
We can use the same service call as above, but this time we request the result in excel format (Note that the SAP Gateway demo system is based on NetWeaver 7.4).
In my case, I got the following result:
total=444,fw=120,app=20,gwtotal=444,gwhub=33,gwrfcoh=0,gwbe=87,gwapp=20,gwnongw=304
We can see that the gwnongw value is added to the total processing time of the service.
gwtotal = fw + gwapp + gwnongw
In the above example:
gwtotal = 444 = 120 + 20 + 304
6. Example 4
This example is used to showcase a value for the parameters gwbewait and gwappsum
These figures are sent whenever a $batch request is sent in parallelised manner.
Background
Usually a $batch request is used to execute multiple operations within one request.
Instead of being executed consecutively, these operations can be executed in parallel, in order to save time.
As per default, the parallelization of $batch requests is switched on.
But it can be configured: enable, disable and specify the max number of parallel queries.
Please refer to the Appendix section below to learn how to configure it.
For more information about parallelization, please refer to the Links section below.
The parameters gwbewait and gwappsum can be used to help optimizing the performance for $batch requests.
Now let’s execute a sample request.
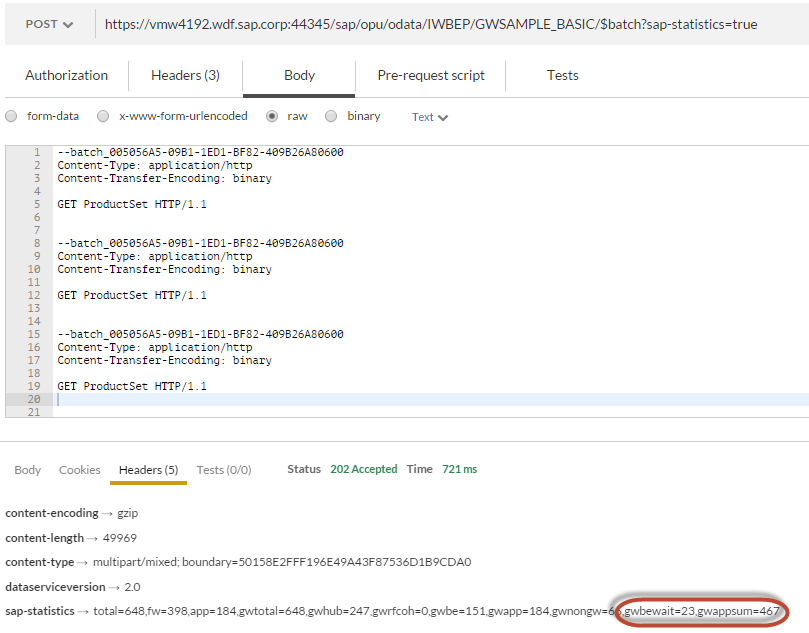
We can again use the GWSAMPLE_BASIC service on the demo system, and execute a $batch request with enabled statistic measurement.
In the request body, we simply specify 3 GET requests
The details for this sample request are as follows:
| URL | https://sapes4.sapdevcenter.com/sap/opu/odata/IWBEP/GWSAMPLE_BASIC/$batch?sap-statistics=true |
| Header | Header-Name: Content-Type Header-Value: multipart/mixed;boundary=batch_005056A5-09B1-1ED1-BF82-409B26A80600 |
| Request body | --batch_005056A5-09B1-1ED1-BF82-409B26A80600 Content-Type: application/http Content-Transfer-Encoding: binary GET ProductSet HTTP/1.1 --batch_005056A5-09B1-1ED1-BF82-409B26A80600 Content-Type: application/http Content-Transfer-Encoding: binary GET ProductSet HTTP/1.1 --batch_005056A5-09B1-1ED1-BF82-409B26A80600 Content-Type: application/http Content-Transfer-Encoding: binary GET ProductSet HTTP/1.1 --batch_005056A5-09B1-1ED1-BF82-409B26A80600-- |
In my case, it looks as follows:
Note:
I've attached an exported sample request file (SCN.json.postman_collection). It can be downloaded and imported in the REST client "Postman".
In my case, I go the following statistics. As expected, the 2 additional parameters are contained:
gwtotal=648,gwhub=247,gwrfcoh=0,gwbe=151,gwapp=184,gwnongw=66,gwbewait=23,gwappsum=467
We already know how to understand most of the figures.
For example:
gwtotal = 648 = 247 + 151 + 184 + 66 + 0
When analyzing the result, we can see that the values for gwbewait and gwappsum are not added to the overall sum in gwtotal
Reason:
- The duration of each operation of the batch cannot be summated, because they’re executed in parallel.
Instead, only the duration of the longest operation is the one that counts (and therefore given in gwapp). In the following section we’ll have a closer look.
The gwappsum value is printed only for information purpose. It serves as base for detailed performance optimization.
- The gwbewait value is already contained in gwbe
7. Example 5
The following 3 example requests are used to have a more detailed look at the performance traces for $batch requests.
I will be executing the same $batch request multiple times, with different parallelization settings, which allows us to compare the results.
The $batch request is the same as described above, it contains 4 GET requests.
The following examples have been executed and measured on my internal system, because the demo system doesn’t allow to change the configuration of the parallelization.
I'm again using the GWSAMPLE_BASIC service.
I'm starting with executing the $batch request with enabled parallelization (which is the default anyway)
In my case, I go the following statistics
gwtotal=534,gwhub=245,gwbe=140,gwapp=149,gwbewait=23,gwappsum=362
In order to understand the gwapp and gwappsum value, I open to the Performance Trace Tool, via transaction /n/IWFND/TRACES
Then I open the tab "Performance Trace", where all my Gateway service calls are listed.
Note:
The performance trace has to be enabled before sending the request with the REST client.
To enable it, just click on the checkbox for "Performance Trace"
For more information, please refer to the Links section below.
In order to display the Performance Trace Summary, I double-click on an entry.
In my case it looks as follows:
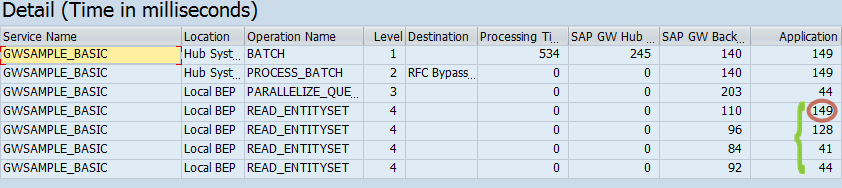
The Performance Trace Summary helps us to understand the statistics.
We can see that the 4 operations that I’ve specified in my $batch request body are listed here (note that they’re executed in parallel)
gwappsum
Similar to the gwapp parameter explained above, here the time is measured that is spent in the implementation of the dataprovider in the Gateway service.
The difference is that in a $batch request, the GET_ENTITYSET method of the dataprovider is called multiple times.
The parameter gwappsum calculates the sum of all calls to GET_ENTITYSET.
This is a kind of virtual value. It would be the case if the 4 calls would have been executed consecutively.
We can verify it in the screenshot above, where the relevant figures are marked with a green curly brace.
gwappsum = 362 = 149 + 128 + 41 + 44
gwapp
This parameter has already been explained above, however in the case of $batch parallelization it has a slightly different semantic.
From the total time that is spent for processing a service request, the gwapp parameter specifies the time that is spent in the custom dataprovider implementation.
In case of parallel execution of multiple GET_ENTITYSET calls, the longest duration is the one that leads to the gwapp time.
In the above screenshot we can verify that the READ_ENTITYSET operation which is marked red is the longest one and it is identical with the gwapp value
gwapp = 149 = the longest READ_ENTITYSET operation
Note:
The summary gives a view on the operations (READ_ENTITYSET), while the detailed view, which can also be accessed with a double-click, lists the methods (GET_ENTITYSET).
The following screenshot is taken from the "Detail" view of the Performance Trace Tool.
The duration of the GWT_ENTITYSET is the same:

gwbewait
This parameter specifies the waiting time in the backend when batch parallelization is done in backend system.
Waiting is required e.g. if no work processes are available and the SAP Gateway framework has to wait until an operation finishes to execute the next one.
Another example, if one of the operations in the batch takes much longer than the others and the framework has to wait until this one finishes.
8. Example 6
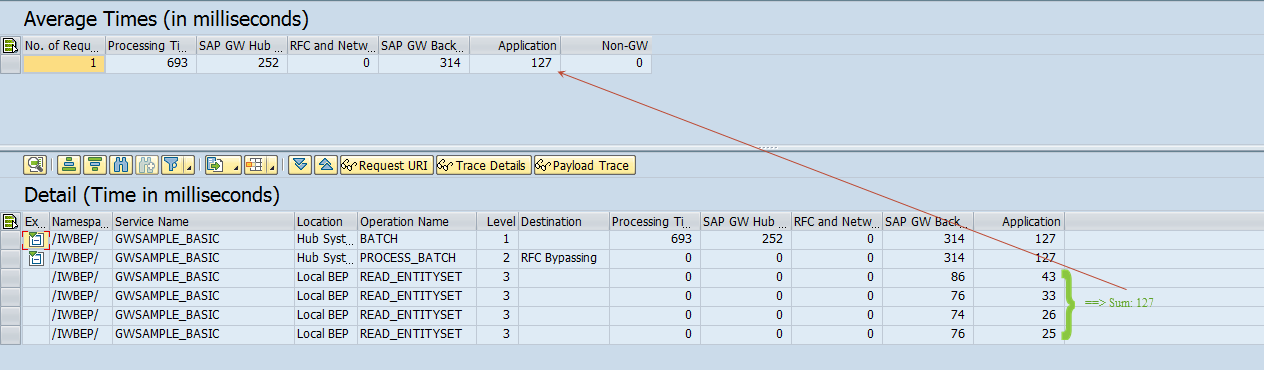
After I've taken a note of the time figures in the example above, I proceed with disabled parallelization.
In my case, I go the following statistics:
gwtotal=693,gwhub=252,gwrfcoh=0,gwbe=314,gwapp=127
The first thing that I can see is that the total processing time is higher (in my example the difference is not very high, because I'm using only 4 GET requests).
I can see that the value of gwapp is the sum of all READ_ENTITYSET operations. This is expected, because the parallelization is switched off.
One more thing that I can see is that here I don’t have a PARALLELIZE_QUERIES operation.
9. Example 7
Let’s have a last quick look at one more option, the customized parallelization.
Activate the parallelization, but reduce the maximum number of parallelized queries.
In my example $batch request, I have 4 operations and I configure the parallelization to execute 2 of them in parallel.

In my case, I go the following statistics:
gwtotal=610,gwhub=270,gwrfcoh=0,gwbe=295,gwapp=45,gwbewait=182,gwappsum=141
This example shows that the total time is higher than the fully parallelized request, but it is still better than if no parallelization is done.
Comparison of the duration depending on the 3 discussed settings:
| Parallelization enabled | Parallelization customized | Parallelization disabled |
|---|---|---|
| gwtotal=534 | gwtotal=610 | gwtotal=693 |
10. Summary
In the present posting, we’ve learned how to use sap-statistics in order to obtain performance figures of executed SAP Gateway service calls.
We’ve learned the meaning of the parameters that are given in the sap-statistics.
We’ve also illustrated under which circumstances some of the parameters are given at all.
We’ve finally had a detailed look at the $batch requests, where the sap-statistics differ depending on the parallelization setting, and we’ve learned how to interpret the figures in the Performance Trace Tool
11. Links
* SAP Gateway Demo System http://scn.sap.com/docs/DOC-31221
* Sample Gateway Services http://scn.sap.com/docs/DOC-31221#section6
* Sign up and get started with the SAP Gateway – Demo Consumtion System: http://scn.sap.com/docs/DOC-40986
* The official documentation of the SAP Performance Statistics:
http://help.sap.com -> Technology Platform -> SAP NetWeaver -> 7.5 -> Function-Oriented View -> SAP Gateway Foundation -> Technical Operations -> Supportability -> Performance Statistics
* Introduction to Performance Statistics and Batch Parallelization: Some new features in SAP NW Gateway 2.0 SP08
* The official documentation of $batch parallelization:
http://help.sap.com -> Technology Platform -> SAP NetWeaver -> 7.5 -> Function-Oriented View -> SAP Gateway Foundation -> Configuration Guide -> SAP Gateway Configuration -> Service Development in Backend -> Defining Parallelization
You may also refer to this SCN document for a description and the availability of this feature
* The official documentation about SAP Gateway hub system and backend system (Deployment Options)
http://help.sap.com -> Technology Platform -> SAP NetWeaver -> 7.5 -> Function-Oriented View -> SAP Gateway Foundation -> Master Guide -> Deployment Options
* Read Access Logging (RAL) documentation:
http://help.sap.com -> Technology Platform -> SAP NetWeaver -> 7.5 -> Function-Oriented View -> SAP Gateway Foundation -> Technical Operations -> RAL
* Excel support documentation
http://help.sap.com -> Technology Platform -> SAP NetWeaver -> 7.5 -> Function-Oriented View -> SAP Gateway Foundation -> Developer Guide -> OData Channel -> Advanced -> Excel Support
* Tracing Tools documentation
http://help.sap.com -> Technology Platform -> SAP NetWeaver -> 7.5 -> Function-Oriented View -> SAP Gateway Foundation -> Technical Operations -> Supportability -> Configuring Tracing Tools
FAQ Performance Trace http://scn.sap.com/docs/DOC-52033
This blog might be useful as well: Speed up your Gateway services using Parallelization
12. Appendix
12.1. How to enable/disable the $batch parallelization for all services
As per default, the operations in a batch request are executed in parallel.
The $batch parallelization can not only be switched on/off, but it can also be configured by specifying the maximum number of calls to be parallelised.
This is valid for all SAP Gateway services in a system.
To disable or maintain this behavior for all services, go to transaction SPRO
IMG -> SAP NetWeaver -> Gateway Service Enablement -> Backend OData Channel -> Configuration Settings -> Define Parallelization .

12.2. How to enable/disable the $batch parallelization for one service
If you don't want to disable the batch parallelization for all services, but instead want to disable it for one single service, there are several possibilities:
1. Via SAP Gateway Client
Open the SAP Gateway Client with transaction /IWFND/GW_CLIENT
Click on “Service Implementation”

This takes you to the “Display Service” screen, where the “Configuration” can be accessed:

In the “Change Configuration” screen, the $batch parallelization can be deactivated for the selected service only:

2. Via SPRO
You can use the SAP project reference object (transaction SPRO) to open the IMG activity “Maintain Service”

There, you can enter the Technical Service Name, then press “Display” in order to open the “Display Service” screen.

3. Via “Activate and Maintain Services”
Open the tool with transaction /n/IWFND/MAINT_SERVICE
Search and select the desired service
Then, in the bottom right corner, in the “System Aliases” section, there’s again the “Service Implementation” button:

12.3. How to enable performance traces
Go to transaction /n/IWFND/TRACES
Your user should be selected on the left pane, otherwise it has to be added via context menu
On the right pane, enable the checkbox for "Performance Trace".

This activates the tracing for 2 hours.
Now execute some Gateway service calls (of course, only services that are running on the same system), e.g. using the SAP Gateway Client (transaction /n/IWFND/GW_CLIENT)
Afterwards, change back to the Tracing Tools and click on the Performance Trace tab.
The service calls are listed there:

Click the spectacles button to open the Summary View.
Note that multiselection is supported. It will give you average numbers in the summary.

In order to proceed to the detailed view, click the "Trace Details" button.
The details view allows to view the time and duration figures for each method and submethod.

- SAP Managed Tags:
- SAP Gateway
Labels:
9 Comments
You must be a registered user to add a comment. If you've already registered, sign in. Otherwise, register and sign in.
Labels in this area
-
ABAP CDS Views - CDC (Change Data Capture)
2 -
AI
1 -
Analyze Workload Data
1 -
BTP
1 -
Business and IT Integration
2 -
Business application stu
1 -
Business Technology Platform
1 -
Business Trends
1,661 -
Business Trends
87 -
CAP
1 -
cf
1 -
Cloud Foundry
1 -
Confluent
1 -
Customer COE Basics and Fundamentals
1 -
Customer COE Latest and Greatest
3 -
Customer Data Browser app
1 -
Data Analysis Tool
1 -
data migration
1 -
data transfer
1 -
Datasphere
2 -
Event Information
1,400 -
Event Information
64 -
Expert
1 -
Expert Insights
178 -
Expert Insights
273 -
General
1 -
Google cloud
1 -
Google Next'24
1 -
Kafka
1 -
Life at SAP
784 -
Life at SAP
11 -
Migrate your Data App
1 -
MTA
1 -
Network Performance Analysis
1 -
NodeJS
1 -
PDF
1 -
POC
1 -
Product Updates
4,577 -
Product Updates
325 -
Replication Flow
1 -
RisewithSAP
1 -
SAP BTP
1 -
SAP BTP Cloud Foundry
1 -
SAP Cloud ALM
1 -
SAP Cloud Application Programming Model
1 -
SAP Datasphere
2 -
SAP S4HANA Cloud
1 -
SAP S4HANA Migration Cockpit
1 -
Technology Updates
6,886 -
Technology Updates
403 -
Workload Fluctuations
1
Related Content
- SAP HANA Cloud Vector Engine: Quick FAQ Reference in Technology Blogs by SAP
- Capture Your Own Workload Statistics in the ABAP Environment in the Cloud in Technology Blogs by SAP
- 10+ ways to reshape your SAP landscape with SAP Business Technology Platform – Blog 4 in Technology Blogs by SAP
- Data Flows - The Python Script Operator and why you should avoid it in Technology Blogs by Members
- SAP Build Code - Speed up your development with Generative AI Assistant - Joule in Technology Blogs by SAP
Top kudoed authors
| User | Count |
|---|---|
| 12 | |
| 10 | |
| 9 | |
| 7 | |
| 7 | |
| 7 | |
| 6 | |
| 6 | |
| 5 | |
| 4 |