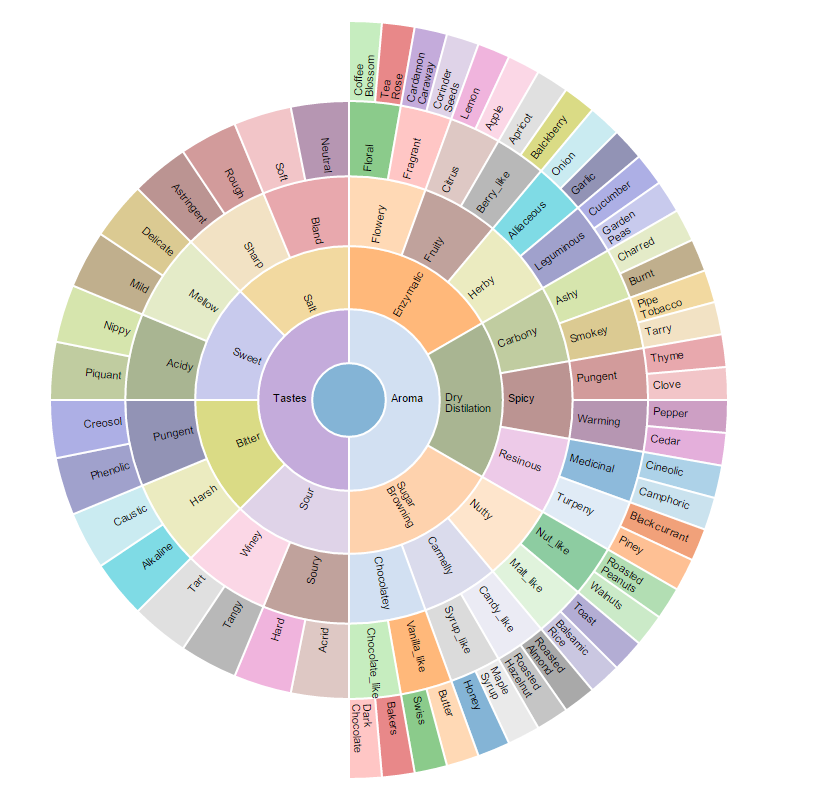
In conjunction to my earlier blog on the Sequences Sunburst extension, this blog is about another similar sunburst chart called the Sunburst Zoomable Wheel, based on the Coffee Flavor Wheel below:

This sunburst chart is a hierarchical chart that represents the grouping and sub grouping of categories, in this case, the different flavors of coffee. When a particular section is clicked on, the wheel zooms in to make that section the parent node and also show its child nodes, whilst canceling out the parent and grandparent nodes of that selected node. To zoom out back to the original hierarchy structure, the center node should be clicked. This allows users to be able to focus on and view only particular sections of a hierarchy that they are interested in. It also helps understand the hierarchical organization better.
This chart is extensible to numerous other use cases that have anything to do with hierarchy. For example, in a business setting, the structure of an organization, its different teams, persons responsible for those teams, and many more representations. The usability of this chart extends to infinite use cases, from categories of movies, scientific research on different species and subspecies, the list goes on and on.
The actual construction and building of this sunburst chart is very similar to that of the Sequences Sunburst chart I mentioned earlier. We just need to replace the mouse hover overs with a zooming function, and also the mouseover event with a click event. And of course, we can play around with the CSS and make the chart look the way we want. I will just skim through the main points in this blog.
DATA AND COLORS
Now the structure of the sample dataset is very similar to that of the Sequences Sunburst. If we recall, in that one we had one dimension set for the sequence item names, and a measure set for the number of hits. Now in the original coffee wheel, the first dimension set is the same as in the Sequences Sunburst - the long string for the category names that we need to break up in our code. However, the second dimension set has alphanumeric values for colors (#123def for example). The thing with extension building is, there has to be at least one measure. So we create another column in our dataset for the measure. We call it "Value" and put random values (1, 1, 1,...) because we aren't going to use it anyway.
And we also remove the color dimension set because we want to use the color palette for Lumira. So now we have one dimension set and one measure set:

We can check this by adding a console statement:
console.log(data);

As expected, we have our dimensions and a useless measure in tow.
And we also push in the color palette:

CLICK FUNCTION
We replace the mouseover() function from the other sunburst chart with a click() function. This function defines what happens when sections of the sunburst are clicked on, basically zoom in and zoom out functions.

This click() function, in turn calls the arcTween() and isParentOf() functions.
REDESIGN THE CSS
We just reduce the opacity of the sections and play around with the font a bit.
As a result, we get this lovely chart in Web IDE
DEPLOY TO LUMIRA
After packaging and installing the extension in Lumira, we have:

This extension is now available on SAP/lumira-extension-viz · GitHub
Feel free to reuse it with your own custom datasets and add your own fun tweaks. Good luck visualizing your hierarchy!
