I remember the t-shirt first. The classic superman diamond but instead of an S inside was a DG. It was blue on grey - I liked the colours. And the shirt looked comfortable - tri-blended fabric I was told later. DataGeek it said. The SAP logo was on the sleeve. I didn't know anything about it but I wanted that shirt. I'm a geek. I like data. I work for SAP and use SAP software. That shirt was meant to be mine.
Little did I know 2 years later, not only would I have the shirt but I'd be working with DataGeek - now DataGenius - team helping them scale their contest on our platform, Idea Place. What started as a small contest for dataviz geeks has now grown into a group of data visualization experts that were so passionate they could be called upon by SAP to create complex visualizations to present to UN representatives, charities and NGOs at the world launch of the new Global Sustainable Development Goals.
It’s a pretty big jump and a pretty great contest. So I thought I’d give a brief explanation and history of DataGenius or DataGeek as it's historically known.
What is it?
A contest to a get a cool t-shirt. You submit a story with charts/visualizations about insights you found from a dataset(s) using SAP Lumira. You get a cool t-shirt and other special swag and recognition of your skills.
2012 - Inception
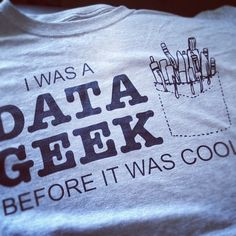
Nic Smith, a long time SAP Marketing Guru, supporter of the community and killer basketball player, imagines crowdsourcing Lumira (then SAP Visual Intelligence) visualizations from their very passionate community. Submitters got a t-shirt proclaiming them a DataGeek for their efforts. Right from the get go SAP execs loved it. Michael Reh wore the t-shirt "I was a DATAGEEK before it was cool" on stage at TechEd 2012. Dr. Vishal Sikka declared the world needed more DataGeeks at SAPPHIRE. The results were around 20 entries from passionate and impressively inventive SAP community members. The first year included possibly the most famous Datageek entry: A data visualization video to Gangnam Style. Don't ask me how the submitter used a scatter chart to make an image of Psy but it's pretty impressive.
2013 - The super fandom is formed
Having tasted success, DataGeek continues. The community demands it. That year, Man of Steel, the latest Superman movie, came out. Happily the results of that year's Datageek contest were, in my opinion, better than the movie (why can't DC ever get a superman movie right?). The tri-blend t-shirt with a blue Superman-esque logo was epic. The video trailer was played at ASUG BusinessObjects User Conference, Timo Elliot is tweeting this t-shirt and customers and partners are posting pics every which a way. 160+ entries from 35 countries and 25 million in social reach saw this contest vanquish the Lord of Dark Data. Check out one of the more fun entries and a flashback to 2013: #Sharknado Social Media Analysis Using SAP Predictive Analysis.
2014 - The fandom continues to conquer
This year it's bigger, it's Games of Thronsier, it's received even more entries the before. The viz-a-thon (visualization hackathon) with Doctors without Borders at TechEd attracted 60+ attendees. On top of that they get 200+ entries and 5 million+ impressions through Twitter.
2015 - DataGeek to DataGenius to Sustainable Development
This year the team wanted to scale up beyond SCN and therefore came to Idea Place - our service and platform that specializes in crowdsourcing. And this time they're not staying on earth - they went galactic with DataGenius: The Data Awakens with a spacey theme in honour of an upcoming movie which will remain nameless (due to the parent company loving to sue :wink: ). And as every year before, they have pushed it bigger, further and faster than ever. There are now grand prizes ($10,000 to charity), passes to SAPPHIRE NOW, separate awards from partners and University Alliances students. The opportunities DataGenius is creating for SAP have also expanded. It was because of a DataGenius collaboration, SAP got to present at the UN event where the new 17 Sustainable Development Goals were launched this September. When the opportunity arose, the DataGenius organizing team reached out to the DataGeek/DataGenius community for analyses of PEPFAR (the United States President's Emergency Plan for Aids Relief) data. Their data visualizations allowed participation in the Global Goals Community Data event in Washington D.C. on September 17-18th, 2015 and later at the UN Global Goals launch event. Visualizations created by Alberto Cairo, a DataGenius community member, now grace the globalgoals.org site.
This year's entries have been heavily weighted towards topics of social good. From endangered species to osteoporosis. Single visualizations to World Bank extensions. DataGenius seems to be transforming from a community to a force for social good. Continuing on this trend, the DataGenius had a viz-a-thon at TechEd Vegas 2015 with Made in a Free World - they help identify where slave labour may end up in a company's supply chain. Read more about Made in a Free World and the viz-a-thon here.
Submission for this years content closes on November 30th, 2015. Public voting to help decide the People's Choice winners goes December 1st - 8th, 2015.
Where will it go next?
But where will it go next? I don’t know - and Nic doesn’t either. What I do know is I still have my superhero t-shirt from 2013 and still think it’s stands for something special.