Currently, Design Studio does not support color palette for chart component. To use different colors in chart, designer has to specify color code one series by one series in the Additional Property.
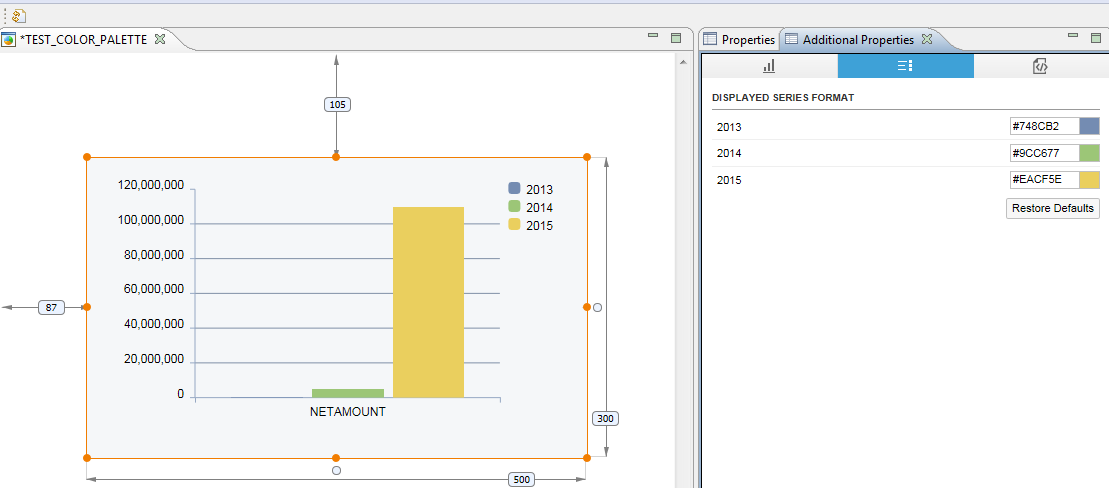
It can be time consuming. Besides, we can only specify existing series in Additional Property. In other words, if there is more series in the future, those series will have default colors.
One workaround is to modify .biapp file in the notepad directly.
Step1: put a chart in canvas

Step2: close the application, go to repository and open .biapp

Step 3: locate the Chart component

Step 4: Paste color palette code under the chart component

<bi:property name="ADDITIONAL_PROPERTIES">
<bi:value><![CDATA[{"dataSeriesFormat":{"data":["color1","color2"],"changedData":{"0":" color1","1":" color2"}}}]]></bi:value>
</bi:property>
For example,
<bi:value><![CDATA[{"dataSeriesFormat":{"data":["#000000","#272727","#3C3C3C","#4F4F4F","#5B5B5B","#6C6C6C","#7B7B7B","#8E8E8E","#9D9D9D","#ADADAD"],"changedData":{"0":"#000000","1":"#272727","2":"#3C3C3C","3":"#4F4F4F","4":"#5B5B5B","5":"#6C6C6C","6":"#7B7B7B","7":"#8E8E8E","8":"#9D9D9D","9":"#ADADAD"}}}]]></bi:value>
Step 5: Save the .biapp, open application, and bind the data source

Note that we have to paste for all the charts one by one. But I believe this is much faster than to modify in Additional Property.
Enjoy!
