
- SAP Community
- Products and Technology
- Technology
- Technology Blogs by Members
- Aboriginal Australia Versus Non-Indigenous Austral...
Technology Blogs by Members
Explore a vibrant mix of technical expertise, industry insights, and tech buzz in member blogs covering SAP products, technology, and events. Get in the mix!
Turn on suggestions
Auto-suggest helps you quickly narrow down your search results by suggesting possible matches as you type.
Showing results for
Former Member
Options
- Subscribe to RSS Feed
- Mark as New
- Mark as Read
- Bookmark
- Subscribe
- Printer Friendly Page
- Report Inappropriate Content
10-16-2015
5:24 AM
This blog is about our journey of discovery into how Aboriginal Australia differs from Non-Indigenous Australia. The Blog was written by Patrick Thomson and Aries Aprianto, two students in ERP Systems in the College of Business at Victoria University in Melbourne, Australia. As part of our Business Analytics course Associate Professor Paul Hawking gave us an assignment to use the SAP visualization tool Lumira to create a series of visualizations of data to tell our story about Australia. The accompanying video is made using Adobe Captivate to explain our findings. We used the Australian Bureau of Statistics datasets from the 2011 Census to delve into certain topics and find what highlights the differences between Aboriginal and Non-Indigenous Australia. Please join us on the journey of discovery.
Who are the Aboriginal people of Australia?
Let’s firstly look at what defines Aboriginal people: on the Aboriginal Culture website (http://www.aboriginalculture.com.au/introduction.shtml), “The word "aborigine" (with a little "a") means one of the original native inhabitants of any country. The word "Aborigine" (with a capital "A") is used to describe the indigenous people of Australia. In Australia, many non-Aboriginal people use the terms "Aboriginal" and "Aboriginals" as singular and plural nouns for the people. Aborigines describe themselves using the various words which mean "person" from each of their own different language groups (tribes).”
In Our Common Bond 2013 (http://www.border.gov.au/Trav/Citi/Lear/Citizenship-test/Australian-citizenship-test-resource) we learn that the first inhabitants of Australia were the Aboriginal and Torres Strait Islander people. They have one of the oldest continuing cultures in the world and have lived here for 40000-60000 years. They have a deep connection to the land that is expressed in theirs stories, art and dance. European settlement arrived in Australia with the First Fleet on 26 January 1788, and we now celebrate Australia Day on 26 January every year.
Of Australia’s three flags (National flag, Aboriginal Flag and the Torres Strait Islander flag) we would like to highlight and discuss the Aboriginal flag, which was designed by Harold Thomas, an artist and an Aboriginal in 1971. “The black represents the Aboriginal people, the red the earth and their spiritual relationship to the land, and the yellow the sun, the giver of life”.

We were interested to learn that “Aborigines have differing views on how their culture should be described. On the one hand, people are proud of their culture and want outsiders to know of it. They have seen the impact of European culture in Australia and the threat this has to their own. Fearing the loss of their knowledge, both secular (non-religious) and sacred, they have imparted much that was once secret, known only to the most senior members of their clans, to explorers, missionaries, pastoralists, interested visitors and anthropologists. On the other hand, in order to continue their cultural traditions and maintain law and order, they need some of the secrecy of their initiation rites and ceremonies kept. This secrecy makes the process meaningful for future generations.” (http://www.aboriginalculture.com.au/introduction.shtml)
This shows the damage that the Western Invasion and influence have had on the Aboriginal people and their culture. The difference Aboriginal peoples of Australia are seen as its Traditional Owners of the land and this is recognized in any official ceremony.
We decided to compare the Indigenous and Non-Indigenous people in Australia using the ABS statistics and datasets from the 2011 Census by looking at:
- Population breakdown
- Languages spoken by Aboriginal people
- Household make-up
- Education
- Crime statistics by population group
What story does statistics tell us about Australia?
Let’s know look at what we learnt from the statistics we had and the subsequent visualisation Lumira provided. We discuss the graphs in the video in sequence. The blog detail can be used in conjunction with the video to provide more detail.
In SAP Lumira, we have to treat the states as values therefore we have to change the setting from row into column as value in order to visualise data in SAP Lumira. Firstly we created a graph of population by adding the numbers of “Aboriginal and Torres Strait Islander people”, “Non-Indigenous people” and “Total Population 2011 Census” as Y Axis. Lastly we added “Origin” as Australian States into the X Axis. In the graph, we found that in the 2011 Census, the total population was 20,446,236 which of 19,898,113 were Non-Indigenous people and 548,123 were Aboriginal and Torres Strait Island people.

In the next graph, we were interested to look at the population numbers in states. We found that the highest number of Aboriginal people were in New South Wales with 172,624, the highest second number in Queensland with 155,825 and the lowest number in the Australian Capital Territory with 5,184.

In the language graph, if we look at the languages spoken by Aboriginal people - most aboriginal people speak English with only about 61000 speaking an indigenous language. This indicates rightly or wrongly how they associate with a western English-speaking culture or how important the retention of their Aboriginal culture is too them.

When looking at the families graph it shows the types of families amongst Aboriginal and Non-Indigenous families - there are far more non-indigenous families without dependent children than aboriginal families. This would show a cultural bias in western families to either not have children or to have an empty nest with 54% vs 36%. In the single parent families there are far more aboriginal families than non-indigenous families at 28% vs 9%. When digging deeper it was however not possible to easily find divorce rates between the different population groups. This may indicate that there are more single parent Aboriginal families or a higher divorce rate.
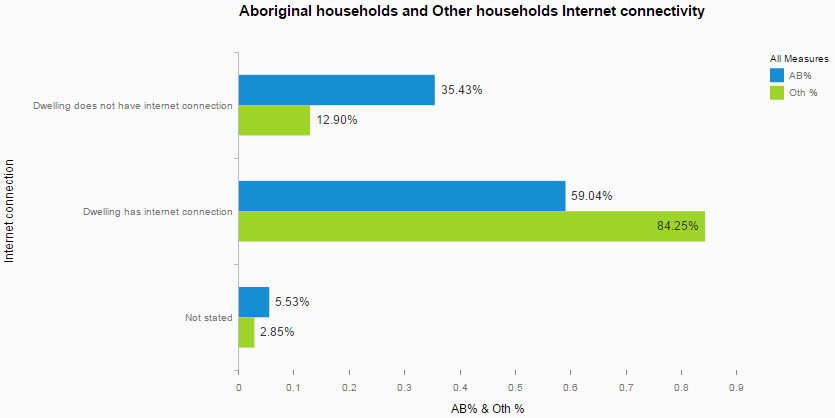
The Internet connectivity graph indicates a very big disparity of dwellings without internet connection in the aboriginal community at 35% compared to non-indigenous communities at only 13%. Internet connectivity is 84% for non-indigenous population vs 59% for the aboriginal population. Some of this may however be a factor of rural regions and availability to the internet more than choice. Economic situations may also play a role here.
When looking at the education graph there is a very interesting trend towards better educated youth. Amongs the respondents aged over 45 years of age there were only 13% of the Aboriginal population which had a year 12 education against non-indigenous where that was 37% or nearly three times as many with a year 12 education. When looking at the younger age group from 20-24 years of age this looks a lot better where it has risen to 37 % Aboriginal and 75% non-indigenous which is really heart-warming.

The housing graph shows how many more Aboriginal people rent houses at 59% vs 29% for non-indigenous population than own them which points to a certain economic reality which could hopefully be addressed in the future through higher employment figures. Owned houses are only 36% aboriginal vs non-indigenous at 68%, some of this may be a historical disadvantage amongst the Aboriginal population.

We have decided to highlight the top three crimes aboriginal people are involved on this graph and then the same in the next graph for the non-indigenous population.

The three highest crimes are assault which could highlight domestic violence. Second is unlawful entry which could be trespassing or the equivalent of breaking and entering in other words. The last is justice proceedings which could show an aversion to western norms of laws and rules.

The three highest crimes are assault which could highlight domestic violence. Second is unlawful entry which could be trespassing or the equivalent of breaking and entering in other words. The last is justice proceedings which could show an aversion to western norms of laws and rules.

Conclusion
In conclusion we would like to highlight the things we have learnt from this study. We have learnt what a great and user friendly visualisation tool SAP Lumira is. We have also seen the differences between the Traditional Owners of Australia and the Non-Indigenous population living here today. This is illustrated by the differences in education, housing and crime statistics. We hope that this can be addressed through various programs of education but also a cultural awareness of what is important to the various cultures living in Australia.
Tools
SAP Lumira
We both have done an SAP Lumira workshop in our Business Analytics subject’s tutorial and discovered the benefits of SAP Lumira when we were doing our research for this assignment. As we live a fair distance from each other on opposite sides of Melbourne, we found that we could easily share our story in SAP Lumira with the Visualize and Compose features. We could fine-tune the graphs and share our changes to give us specific points of interest in the statistics and graphs via email and phone. This resulted in us saving travelling time through using technology to keep working efficiently on our assignment.
Adobe Captivate
We used Adobe Captivate to record our findings into video. The images of aboriginal people and statistics from SAP Lumira were stored into Adobe Captivate library in. We used the data statistics to explain our findings, and recorded our voices to explain our findings. Once the created slides were accompanied with audio, we could publish the video on Youtube. Uploading the video into Youtube is easy as Adobe Captivate can generate our slides into video with MP4 type.
References
SAP Lumira, https://www.sap.com/australia/cmp/ppc/crm-xa14-ppc-5an/index.html?campaigncode=CRM-XA15-PPC-1ITANADG..., viewed 14/09/2015.
Australian Bureau of Statistics, http://www.abs.gov.au/, viewed 15/09/2015.
Ausflag Our Own Flag, http://www.ausflag.com.au/aboriginal_flag.asp, viewed 5/10/2015.
Aboriginal Culture, http://www.aboriginalculture.com.au/introduction.shtml, viewed 5/10/2015.
Our Common Bond, http://www.border.gov.au/Trav/Citi/Lear/Citizenship-test/Australian-citizenship-test-resource, viewed 11/10/2015.
- SAP Managed Tags:
- SAP Lumira
You must be a registered user to add a comment. If you've already registered, sign in. Otherwise, register and sign in.
Labels in this area
-
"automatische backups"
1 -
"regelmäßige sicherung"
1 -
"TypeScript" "Development" "FeedBack"
1 -
505 Technology Updates 53
1 -
ABAP
14 -
ABAP API
1 -
ABAP CDS Views
2 -
ABAP CDS Views - BW Extraction
1 -
ABAP CDS Views - CDC (Change Data Capture)
1 -
ABAP class
2 -
ABAP Cloud
2 -
ABAP Development
5 -
ABAP in Eclipse
1 -
ABAP Platform Trial
1 -
ABAP Programming
2 -
abap technical
1 -
absl
2 -
access data from SAP Datasphere directly from Snowflake
1 -
Access data from SAP datasphere to Qliksense
1 -
Accrual
1 -
action
1 -
adapter modules
1 -
Addon
1 -
Adobe Document Services
1 -
ADS
1 -
ADS Config
1 -
ADS with ABAP
1 -
ADS with Java
1 -
ADT
2 -
Advance Shipping and Receiving
1 -
Advanced Event Mesh
3 -
AEM
1 -
AI
7 -
AI Launchpad
1 -
AI Projects
1 -
AIML
9 -
Alert in Sap analytical cloud
1 -
Amazon S3
1 -
Analytical Dataset
1 -
Analytical Model
1 -
Analytics
1 -
Analyze Workload Data
1 -
annotations
1 -
API
1 -
API and Integration
3 -
API Call
2 -
Application Architecture
1 -
Application Development
5 -
Application Development for SAP HANA Cloud
3 -
Applications and Business Processes (AP)
1 -
Artificial Intelligence
1 -
Artificial Intelligence (AI)
5 -
Artificial Intelligence (AI) 1 Business Trends 363 Business Trends 8 Digital Transformation with Cloud ERP (DT) 1 Event Information 462 Event Information 15 Expert Insights 114 Expert Insights 76 Life at SAP 418 Life at SAP 1 Product Updates 4
1 -
Artificial Intelligence (AI) blockchain Data & Analytics
1 -
Artificial Intelligence (AI) blockchain Data & Analytics Intelligent Enterprise
1 -
Artificial Intelligence (AI) blockchain Data & Analytics Intelligent Enterprise Oil Gas IoT Exploration Production
1 -
Artificial Intelligence (AI) blockchain Data & Analytics Intelligent Enterprise sustainability responsibility esg social compliance cybersecurity risk
1 -
ASE
1 -
ASR
2 -
ASUG
1 -
Attachments
1 -
Authorisations
1 -
Automating Processes
1 -
Automation
2 -
aws
2 -
Azure
1 -
Azure AI Studio
1 -
B2B Integration
1 -
Backorder Processing
1 -
Backup
1 -
Backup and Recovery
1 -
Backup schedule
1 -
BADI_MATERIAL_CHECK error message
1 -
Bank
1 -
BAS
1 -
basis
2 -
Basis Monitoring & Tcodes with Key notes
2 -
Batch Management
1 -
BDC
1 -
Best Practice
1 -
bitcoin
1 -
Blockchain
3 -
bodl
1 -
BOP in aATP
1 -
BOP Segments
1 -
BOP Strategies
1 -
BOP Variant
1 -
BPC
1 -
BPC LIVE
1 -
BTP
12 -
BTP Destination
2 -
Business AI
1 -
Business and IT Integration
1 -
Business application stu
1 -
Business Application Studio
1 -
Business Architecture
1 -
Business Communication Services
1 -
Business Continuity
1 -
Business Data Fabric
3 -
Business Partner
12 -
Business Partner Master Data
10 -
Business Technology Platform
2 -
Business Trends
4 -
CA
1 -
calculation view
1 -
CAP
3 -
Capgemini
1 -
CAPM
1 -
Catalyst for Efficiency: Revolutionizing SAP Integration Suite with Artificial Intelligence (AI) and
1 -
CCMS
2 -
CDQ
12 -
CDS
2 -
Cental Finance
1 -
Certificates
1 -
CFL
1 -
Change Management
1 -
chatbot
1 -
chatgpt
3 -
CL_SALV_TABLE
2 -
Class Runner
1 -
Classrunner
1 -
Cloud ALM Monitoring
1 -
Cloud ALM Operations
1 -
cloud connector
1 -
Cloud Extensibility
1 -
Cloud Foundry
4 -
Cloud Integration
6 -
Cloud Platform Integration
2 -
cloudalm
1 -
communication
1 -
Compensation Information Management
1 -
Compensation Management
1 -
Compliance
1 -
Compound Employee API
1 -
Configuration
1 -
Connectors
1 -
Consolidation Extension for SAP Analytics Cloud
2 -
Control Indicators.
1 -
Controller-Service-Repository pattern
1 -
Conversion
1 -
Cosine similarity
1 -
cryptocurrency
1 -
CSI
1 -
ctms
1 -
Custom chatbot
3 -
Custom Destination Service
1 -
custom fields
1 -
Customer Experience
1 -
Customer Journey
1 -
Customizing
1 -
cyber security
3 -
cybersecurity
1 -
Data
1 -
Data & Analytics
1 -
Data Aging
1 -
Data Analytics
2 -
Data and Analytics (DA)
1 -
Data Archiving
1 -
Data Back-up
1 -
Data Flow
1 -
Data Governance
5 -
Data Integration
2 -
Data Quality
12 -
Data Quality Management
12 -
Data Synchronization
1 -
data transfer
1 -
Data Unleashed
1 -
Data Value
8 -
database tables
1 -
Datasphere
3 -
datenbanksicherung
1 -
dba cockpit
1 -
dbacockpit
1 -
Debugging
2 -
Delimiting Pay Components
1 -
Delta Integrations
1 -
Destination
3 -
Destination Service
1 -
Developer extensibility
1 -
Developing with SAP Integration Suite
1 -
Devops
1 -
digital transformation
1 -
Documentation
1 -
Dot Product
1 -
DQM
1 -
dump database
1 -
dump transaction
1 -
e-Invoice
1 -
E4H Conversion
1 -
Eclipse ADT ABAP Development Tools
2 -
edoc
1 -
edocument
1 -
ELA
1 -
Embedded Consolidation
1 -
Embedding
1 -
Embeddings
1 -
Employee Central
1 -
Employee Central Payroll
1 -
Employee Central Time Off
1 -
Employee Information
1 -
Employee Rehires
1 -
Enable Now
1 -
Enable now manager
1 -
endpoint
1 -
Enhancement Request
1 -
Enterprise Architecture
1 -
ETL Business Analytics with SAP Signavio
1 -
Euclidean distance
1 -
Event Dates
1 -
Event Driven Architecture
1 -
Event Mesh
2 -
Event Reason
1 -
EventBasedIntegration
1 -
EWM
1 -
EWM Outbound configuration
1 -
EWM-TM-Integration
1 -
Existing Event Changes
1 -
Expand
1 -
Expert
2 -
Expert Insights
2 -
Exploits
1 -
Fiori
14 -
Fiori Elements
2 -
Fiori SAPUI5
12 -
Flask
1 -
Full Stack
8 -
Funds Management
1 -
General
1 -
General Splitter
1 -
Generative AI
1 -
Getting Started
1 -
GitHub
8 -
Grants Management
1 -
GraphQL
1 -
groovy
1 -
GTP
1 -
HANA
6 -
HANA Cloud
2 -
Hana Cloud Database Integration
2 -
HANA DB
2 -
HANA XS Advanced
1 -
Historical Events
1 -
home labs
1 -
HowTo
1 -
HR Data Management
1 -
html5
8 -
HTML5 Application
1 -
Identity cards validation
1 -
idm
1 -
Implementation
1 -
input parameter
1 -
instant payments
1 -
Integration
3 -
Integration Advisor
1 -
Integration Architecture
1 -
Integration Center
1 -
Integration Suite
1 -
intelligent enterprise
1 -
iot
1 -
Java
1 -
job
1 -
Job Information Changes
1 -
Job-Related Events
1 -
Job_Event_Information
1 -
joule
4 -
Journal Entries
1 -
Just Ask
1 -
Kerberos for ABAP
8 -
Kerberos for JAVA
8 -
KNN
1 -
Launch Wizard
1 -
Learning Content
2 -
Life at SAP
5 -
lightning
1 -
Linear Regression SAP HANA Cloud
1 -
Loading Indicator
1 -
local tax regulations
1 -
LP
1 -
Machine Learning
2 -
Marketing
1 -
Master Data
3 -
Master Data Management
14 -
Maxdb
2 -
MDG
1 -
MDGM
1 -
MDM
1 -
Message box.
1 -
Messages on RF Device
1 -
Microservices Architecture
1 -
Microsoft Universal Print
1 -
Middleware Solutions
1 -
Migration
5 -
ML Model Development
1 -
Modeling in SAP HANA Cloud
8 -
Monitoring
3 -
MTA
1 -
Multi-Record Scenarios
1 -
Multiple Event Triggers
1 -
Myself Transformation
1 -
Neo
1 -
New Event Creation
1 -
New Feature
1 -
Newcomer
1 -
NodeJS
2 -
ODATA
2 -
OData APIs
1 -
odatav2
1 -
ODATAV4
1 -
ODBC
1 -
ODBC Connection
1 -
Onpremise
1 -
open source
2 -
OpenAI API
1 -
Oracle
1 -
PaPM
1 -
PaPM Dynamic Data Copy through Writer function
1 -
PaPM Remote Call
1 -
PAS-C01
1 -
Pay Component Management
1 -
PGP
1 -
Pickle
1 -
PLANNING ARCHITECTURE
1 -
Popup in Sap analytical cloud
1 -
PostgrSQL
1 -
POSTMAN
1 -
Process Automation
2 -
Product Updates
4 -
PSM
1 -
Public Cloud
1 -
Python
4 -
python library - Document information extraction service
1 -
Qlik
1 -
Qualtrics
1 -
RAP
3 -
RAP BO
2 -
Record Deletion
1 -
Recovery
1 -
recurring payments
1 -
redeply
1 -
Release
1 -
Remote Consumption Model
1 -
Replication Flows
1 -
research
1 -
Resilience
1 -
REST
1 -
REST API
2 -
Retagging Required
1 -
Risk
1 -
Rolling Kernel Switch
1 -
route
1 -
rules
1 -
S4 HANA
1 -
S4 HANA Cloud
1 -
S4 HANA On-Premise
1 -
S4HANA
3 -
S4HANA_OP_2023
2 -
SAC
10 -
SAC PLANNING
9 -
SAP
4 -
SAP ABAP
1 -
SAP Advanced Event Mesh
1 -
SAP AI Core
8 -
SAP AI Launchpad
8 -
SAP Analytic Cloud Compass
1 -
Sap Analytical Cloud
1 -
SAP Analytics Cloud
4 -
SAP Analytics Cloud for Consolidation
3 -
SAP Analytics Cloud Story
1 -
SAP analytics clouds
1 -
SAP BAS
1 -
SAP Basis
6 -
SAP BODS
1 -
SAP BODS certification.
1 -
SAP BTP
21 -
SAP BTP Build Work Zone
2 -
SAP BTP Cloud Foundry
6 -
SAP BTP Costing
1 -
SAP BTP CTMS
1 -
SAP BTP Innovation
1 -
SAP BTP Migration Tool
1 -
SAP BTP SDK IOS
1 -
SAP Build
11 -
SAP Build App
1 -
SAP Build apps
1 -
SAP Build CodeJam
1 -
SAP Build Process Automation
3 -
SAP Build work zone
10 -
SAP Business Objects Platform
1 -
SAP Business Technology
2 -
SAP Business Technology Platform (XP)
1 -
sap bw
1 -
SAP CAP
2 -
SAP CDC
1 -
SAP CDP
1 -
SAP CDS VIEW
1 -
SAP Certification
1 -
SAP Cloud ALM
4 -
SAP Cloud Application Programming Model
1 -
SAP Cloud Integration for Data Services
1 -
SAP cloud platform
8 -
SAP Companion
1 -
SAP CPI
3 -
SAP CPI (Cloud Platform Integration)
2 -
SAP CPI Discover tab
1 -
sap credential store
1 -
SAP Customer Data Cloud
1 -
SAP Customer Data Platform
1 -
SAP Data Intelligence
1 -
SAP Data Migration in Retail Industry
1 -
SAP Data Services
1 -
SAP DATABASE
1 -
SAP Dataspher to Non SAP BI tools
1 -
SAP Datasphere
9 -
SAP DRC
1 -
SAP EWM
1 -
SAP Fiori
3 -
SAP Fiori App Embedding
1 -
Sap Fiori Extension Project Using BAS
1 -
SAP GRC
1 -
SAP HANA
1 -
SAP HCM (Human Capital Management)
1 -
SAP HR Solutions
1 -
SAP IDM
1 -
SAP Integration Suite
9 -
SAP Integrations
4 -
SAP iRPA
2 -
SAP LAGGING AND SLOW
1 -
SAP Learning Class
1 -
SAP Learning Hub
1 -
SAP Master Data
1 -
SAP Odata
2 -
SAP on Azure
1 -
SAP PartnerEdge
1 -
sap partners
1 -
SAP Password Reset
1 -
SAP PO Migration
1 -
SAP Prepackaged Content
1 -
SAP Process Automation
2 -
SAP Process Integration
2 -
SAP Process Orchestration
1 -
SAP S4HANA
2 -
SAP S4HANA Cloud
1 -
SAP S4HANA Cloud for Finance
1 -
SAP S4HANA Cloud private edition
1 -
SAP Sandbox
1 -
SAP STMS
1 -
SAP successfactors
3 -
SAP SuccessFactors HXM Core
1 -
SAP Time
1 -
SAP TM
2 -
SAP Trading Partner Management
1 -
SAP UI5
1 -
SAP Upgrade
1 -
SAP Utilities
1 -
SAP-GUI
8 -
SAP_COM_0276
1 -
SAPBTP
1 -
SAPCPI
1 -
SAPEWM
1 -
sapmentors
1 -
saponaws
2 -
SAPS4HANA
1 -
SAPUI5
5 -
schedule
1 -
Script Operator
1 -
Secure Login Client Setup
8 -
security
9 -
Selenium Testing
1 -
Self Transformation
1 -
Self-Transformation
1 -
SEN
1 -
SEN Manager
1 -
service
1 -
SET_CELL_TYPE
1 -
SET_CELL_TYPE_COLUMN
1 -
SFTP scenario
2 -
Simplex
1 -
Single Sign On
8 -
Singlesource
1 -
SKLearn
1 -
Slow loading
1 -
soap
1 -
Software Development
1 -
SOLMAN
1 -
solman 7.2
2 -
Solution Manager
3 -
sp_dumpdb
1 -
sp_dumptrans
1 -
SQL
1 -
sql script
1 -
SSL
8 -
SSO
8 -
Substring function
1 -
SuccessFactors
1 -
SuccessFactors Platform
1 -
SuccessFactors Time Tracking
1 -
Sybase
1 -
system copy method
1 -
System owner
1 -
Table splitting
1 -
Tax Integration
1 -
Technical article
1 -
Technical articles
1 -
Technology Updates
14 -
Technology Updates
1 -
Technology_Updates
1 -
terraform
1 -
Threats
2 -
Time Collectors
1 -
Time Off
2 -
Time Sheet
1 -
Time Sheet SAP SuccessFactors Time Tracking
1 -
Tips and tricks
2 -
toggle button
1 -
Tools
1 -
Trainings & Certifications
1 -
Transformation Flow
1 -
Transport in SAP BODS
1 -
Transport Management
1 -
TypeScript
2 -
ui designer
1 -
unbind
1 -
Unified Customer Profile
1 -
UPB
1 -
Use of Parameters for Data Copy in PaPM
1 -
User Unlock
1 -
VA02
1 -
Validations
1 -
Vector Database
2 -
Vector Engine
1 -
Visual Studio Code
1 -
VSCode
1 -
Vulnerabilities
1 -
Web SDK
1 -
work zone
1 -
workload
1 -
xsa
1 -
XSA Refresh
1
- « Previous
- Next »
Related Content
- Predictive Forecast Disaggregation in Technology Blogs by SAP
- Unable to access the subaccount in the Europe (Frankfurt) region in Technology Q&A
- Integration Suite is not available for subscription in BTP free-tier in Technology Q&A
- Create Fiori Capability Maturity in Technology Blogs by Members
- Solution for Rubik’s Cube of E-Invoicing in SAP Document and Reporting Compliance in Technology Blogs by Members
Top kudoed authors
| User | Count |
|---|---|
| 8 | |
| 5 | |
| 5 | |
| 4 | |
| 4 | |
| 4 | |
| 4 | |
| 3 | |
| 3 | |
| 3 |