I had left a comment a while back on tammy.powlas great document here: Forecasting Using Time Series Analysis - SAP Predictive Expert Analytics.
I thought I would use one spare hour to "drink my own champagne" and give it a try on the same example with Automated Analytics.
I collected the data at the exact same source - from the Bureau of Transportation Statistics (http://www.rita.dot.gov/bts/acts) and I downloaded US domestic passenger data by year/month from January 1996 to June 2015.
My goals:
- see if I can get a reliable forecasting model.
- see if I can predict the volume of passenger traffic up to December 2017.
I open SAP Predictive Analytics and jump to the Modeler/Time series section.

First I load my very simple .csv file and specify the date format.

I need to tell the software that my date column gives the order of the data set (Order =1 for Month variable).
I can give a quick look to the data - number of passenger enplanements by month.

I set my two variables:
- Month variable is the Time
- my Target variable is Passengers Enplanements.

I will generate my model and ask for 30 forecasts to get the predictions until December 2017.
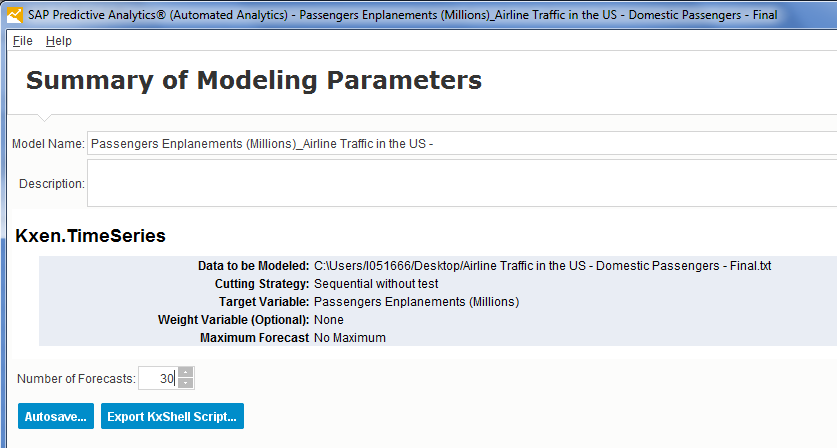
The performance of the model is very good.
98% of the signal is explained and only 2% of the signal cannot be explained, we will understand why later.
The model has a polynomial trend and cycles based on the month of the year.
As Tammy explained, there is more traffic in the summer months due to the summer vacations.

I can see the signal in the View Signal Components window. Real figures appear in green. The ones that are forecasted by my model appear in blue.
We see that we have an outlier here (red rectangle), the model does not really understand what happened in September 2001 (while we do understand and remember).
The rest of the signal is pretty well modeled, although we visually spot some differences in the years 2004 to 2009 with real traffic being higher to the modeled values. Is this due to higher pre-crisis airline traffic?

We can visually get the uncertainty around the 2015 to 2017 forecasts.
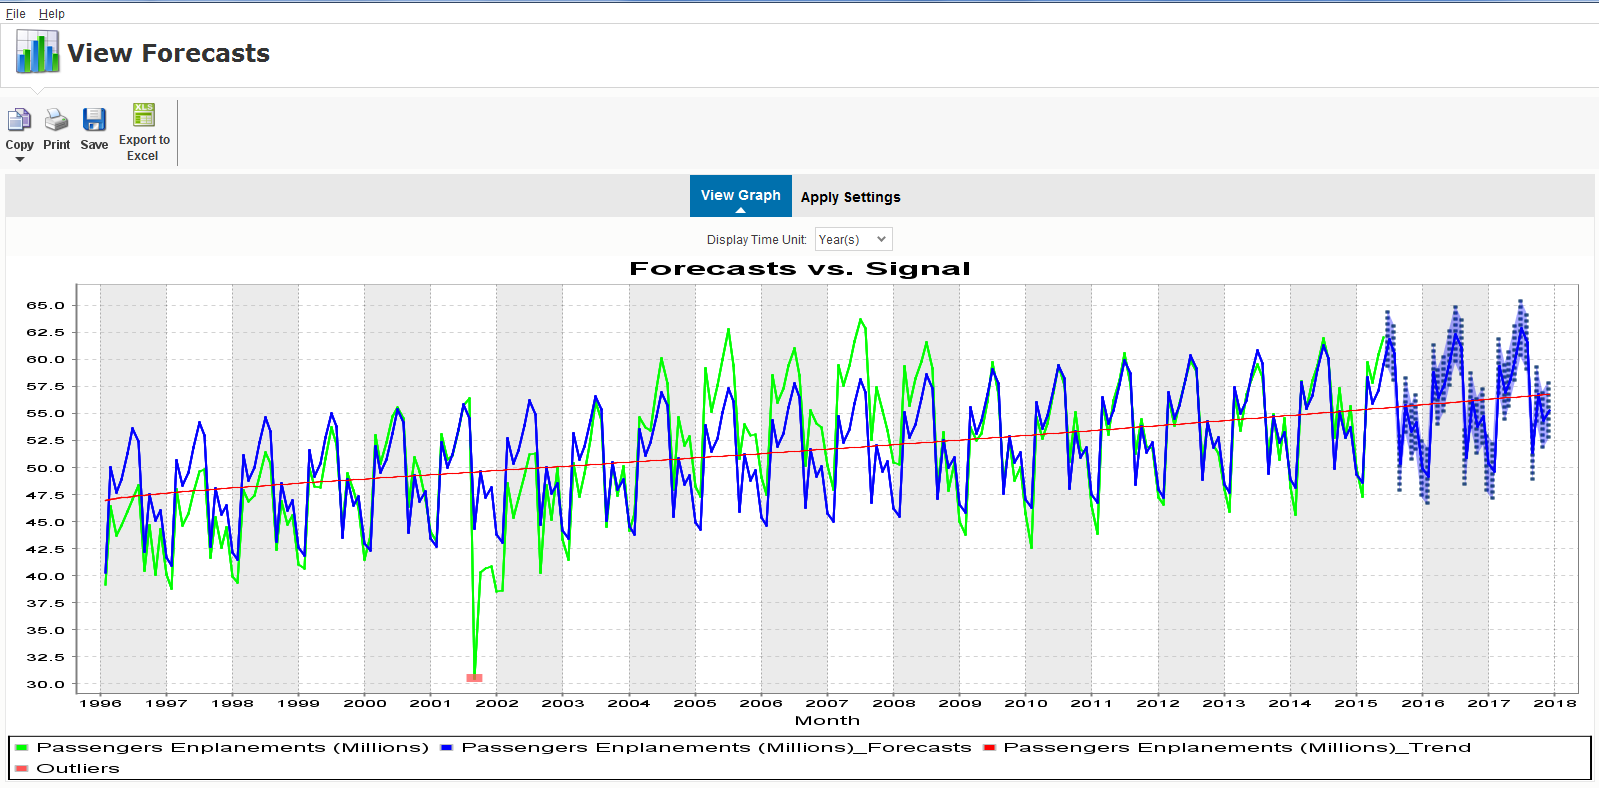
I personally prefer exporting to Excel and seeing the forecasted values there. The projected passenger traffic for the month of December '17 is 55,26 million, the upper bound of the forecasted interval is 57,94 million and the lower bound of the interval is 52,58 million. July 2017 might be the peak with close to 63 million passengers.
We could certainly further improve the accuracy and reliability forecast taking into account more variables beyond the sole date. This is a core capability that is provided by the time series algorithm of Automated Analytics.

Thanks for reading the document, I hope you enjoyed it!
Credits are due to tammy.powlas for the original document idea.
I will be happy to share the data set with anyone interested by this example. You can also download it directly from the link at the beginning of this article.
Antoine
