
- SAP Community
- Products and Technology
- Technology
- Technology Blogs by SAP
- HCI First Steps Part 6 - Identifying issues
Technology Blogs by SAP
Learn how to extend and personalize SAP applications. Follow the SAP technology blog for insights into SAP BTP, ABAP, SAP Analytics Cloud, SAP HANA, and more.
Turn on suggestions
Auto-suggest helps you quickly narrow down your search results by suggesting possible matches as you type.
Showing results for
Product and Topic Expert
Options
- Subscribe to RSS Feed
- Mark as New
- Mark as Read
- Bookmark
- Subscribe
- Printer Friendly Page
- Report Inappropriate Content
10-01-2015
5:31 PM
In the previous installment HCI First Steps Part 5 - Completing the iFlow the integration flow was built, deployed and set to run daily. In the final installment of the series we will be looking at what happens when things go wrong; how to find and resolve errors with your iFlow.
We have now completed the iFlow and deployed it. Each time the iFlow is run, providing tracing is enabled, there will be a log of each step of the process. This trace data can then be integrated into the iFlow so that each step can be examined to verify the input data and the output data to make sure the data is as expected.
To enable tracing the first step is to request tracing be enabled on your tenant. By default this is disabled. Goto the SAP Incident Report portal (https://support.sap.com/kb-incidents/incident.html) and create a new request using the component "LOD-HCI". Making sure to have your tenant id to hand and the S-User as well. Once the ticket has been actioned, tracing will now be enabled for your tenant. Typically tracing is disabled as it has an overhead that could impact the data to day performance in high volume situations.
The first step is to enable the tracing and logging messages in the iFlow. Click outside the iFlow, on the checkerboard pattern and the properties tab will now show the configuration settings for the iFlow

Click on the Runtime Configuration tab since we want to enable debugging and in the “Message Processing Log” option, select “All Events”. Also check the “Enable Debug Trace” checkbox.

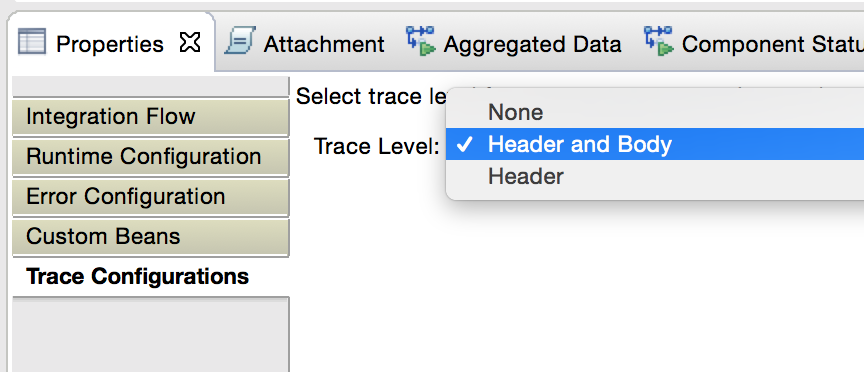
Next choose the "Trace Configurations” tab and change the trace level to “Header and Body"
This is all that is needed to enable the iFlow to generate trace and debug information. Redeploy the iFlow and switch to the “Message Monitoring” tab in the "Integration Operations “ perspective. This view will help assist in seeing how your integration process executed and also where to find the logging and trace messages of the integration flow that was just deployed.

This highlighted areas show the most important features on this view. The “Refresh” button on the top right is used to refresh the list of messages from integration flow executions. In this case there is only one row and that row shows the “WeatherReport” iFlow version 1.0.0 execution was completed successfully. The result of the execution is shown in the Properties tab on the bottom. This shows a textual representation of the execution of the iFlow, which though concise and comprehensive is also not very user friendly. The “View Trace” button on the right of the messages will take the message trace and apply it to each step of the integration flow so that the inputs and outputs can be linked to the graphical iFlow.
Click on the “View Trace” button now. If the button is not enabled then click on the message in the list and then the button will enable.

Note how now each sequence flow is annotated with a yellow envelope. This is the output of the previous step so that makes it possible to view each step of the process and the outputs of the process. Click on the envelope and the properties tab will show the message headers and also the message payload. In the example above the payload will be the XML body that was retrieved by the Request-Reply external service call to obtain the weather.
Remember that in the “Content Modifier” step additional header values were added to the message by extracting the values from the iFlow. These values can now be examined by clicking on the final envelope.

Of course this shows a deployment that was successful, unfortunately despite our best intentions, sometimes something goes wrong. To illustrate this, lets create a new step in our integration flow that will translate JSON to XML. Whilst the output of the request reply is an XML string, the intention is to generate an exception to illustrate in the graphical iFlow what an exception trace looks like.
Right click over the sequence between the Request-Reply and the Content Modifier and from the “Add Message Transformers” menu, select the “Convertor” transformer.

This will insert the default converter which converts from CSV to XML. Right click over the element and change the type to JSON to XML.

The integration flow will now have a new element to transform the response from JSON to XML

Deploy the integration flow as normal and the execution will fail

Click on the Failed line and the “View Trace” button will enable as before. Click this button and the integration flow will now show an error where an exception was generated in the sequence processing.

Click on the error envelope and the properties will now show the exception as well as the body (payload) and header of the message.

However in a number of cases a exception is not raised, it is up to you to handle situations such as where the server is unavailable or the wrong URL is supplied. These are error conditions the iFlow should handle.
Last but not least, sometimes for one reason or another the iFlow will deploy but no run. To simulate this scenario, deploy the iFlow but choose to deploy it to an IFL node rather than an IFLMAP node. Ignore the warning message and continue.

Since IFL nodes are not supported on trial tenants this will deploy but will not run. Unfortunalty no messages will be displayed in the Message Monitoring either. To find out what happened between Deployment and Execution, open the “Tasks View” view and scroll through the tasks list until the task in red is shown.

The big red X stands out and this is the deployment that failed.
In the task trace window scroll under the task list, through the task deployment trace text to see the error. In this case I have hilighted the error: There is no node of type IFL to deploy the integration flow to.
Change the type back to IFLMAP and deploy the integration flow.
This concludes the final instalment of the HCI First Steps series.
- SAP Managed Tags:
- Cloud Integration
4 Comments
You must be a registered user to add a comment. If you've already registered, sign in. Otherwise, register and sign in.
Labels in this area
-
ABAP CDS Views - CDC (Change Data Capture)
2 -
AI
1 -
Analyze Workload Data
1 -
BTP
1 -
Business and IT Integration
2 -
Business application stu
1 -
Business Technology Platform
1 -
Business Trends
1,658 -
Business Trends
91 -
CAP
1 -
cf
1 -
Cloud Foundry
1 -
Confluent
1 -
Customer COE Basics and Fundamentals
1 -
Customer COE Latest and Greatest
3 -
Customer Data Browser app
1 -
Data Analysis Tool
1 -
data migration
1 -
data transfer
1 -
Datasphere
2 -
Event Information
1,400 -
Event Information
66 -
Expert
1 -
Expert Insights
177 -
Expert Insights
296 -
General
1 -
Google cloud
1 -
Google Next'24
1 -
Kafka
1 -
Life at SAP
780 -
Life at SAP
13 -
Migrate your Data App
1 -
MTA
1 -
Network Performance Analysis
1 -
NodeJS
1 -
PDF
1 -
POC
1 -
Product Updates
4,577 -
Product Updates
342 -
Replication Flow
1 -
RisewithSAP
1 -
SAP BTP
1 -
SAP BTP Cloud Foundry
1 -
SAP Cloud ALM
1 -
SAP Cloud Application Programming Model
1 -
SAP Datasphere
2 -
SAP S4HANA Cloud
1 -
SAP S4HANA Migration Cockpit
1 -
Technology Updates
6,873 -
Technology Updates
420 -
Workload Fluctuations
1
Related Content
- Start page of SAP Signavio Process Insights, discovery edition, the 4 pillars and documentation in Technology Blogs by SAP
- Demystifying the Common Super Domain for SAP Mobile Start in Technology Blogs by SAP
- QM Notification Configuration from DMC to ERP in Technology Blogs by Members
- Onboarding Users in SAP Quality Issue Resolution in Technology Blogs by SAP
- Up Net Working Capital, Up Inventory and Down Efficiency. What to do? in Technology Blogs by SAP
Top kudoed authors
| User | Count |
|---|---|
| 37 | |
| 25 | |
| 17 | |
| 13 | |
| 7 | |
| 7 | |
| 7 | |
| 6 | |
| 6 | |
| 6 |