
- SAP Community
- Products and Technology
- Technology
- Technology Blogs by SAP
- Dataset Linking in SAP Lumira
Technology Blogs by SAP
Learn how to extend and personalize SAP applications. Follow the SAP technology blog for insights into SAP BTP, ABAP, SAP Analytics Cloud, SAP HANA, and more.
Turn on suggestions
Auto-suggest helps you quickly narrow down your search results by suggesting possible matches as you type.
Showing results for
Former Member
Options
- Subscribe to RSS Feed
- Mark as New
- Mark as Read
- Bookmark
- Subscribe
- Printer Friendly Page
- Report Inappropriate Content
09-30-2015
6:50 PM
Dataset linking is a feature that was introduced in Lumira 1.27. It allows the analyst to quickly correlate data from multiple datasets without predetermining how and what is required to establish a link. In fact, the workflow in Lumira is designed to allow the user to first think about what common attributes by which to aggregate the measure before deciding what dimension to link on. For instance, you want to see if there is any correlation between regional revenue and census data, such as average household income and other demographic attributes. You can easily discover these insights once the data is broken down by region in a visualization in Lumira.
The flexibility to link datasets within Lumira is especially powerful with the new enhancements that have been added to 1.28. The following scenarios are my attempt to showcase these new capabilities and to explore cases that require adjustments to the links between the datasets to derive the intended result.
Let's start by summarizing what is possible with Dataset Linking in 1.27 and what new enhancements are now available in the 1.28 release:
Lumira 1.27
- Link two datasets
- Link acquired datasets (not available for Hana Online)
- Define links once per story
- Create links that are left outer join
- Detect duplicate values as a result of partial link
- Consume or modify dataset links in Lumira server for BIP and Team Server
- Linked dimension must be used in the visualization
Lumira 1.28
- Select from left outer, full outer, exception or inner join when linking datasets
- Link three or more datasets
- Add secondary dimensions in the visualization
- Available for HANA Online connection
In the scenarios below, I used the following three datasets. You can copy and paste this content into Lumira to follow along or use any supported data source, including your BW queries and HANA views:
Dataset 1:
| Region | Product | Year | Sales |
| Canada | A | 2013 | 70 |
| Canada | B | 2014 | 90 |
| USA | A | 2013 | 100 |
| USA | B | 2014 | 50 |
| USA | C | 2014 | 60 |
Dataset 2:
| Year | Quarter | Global Sales |
| 2013 | Q1 | 250 |
| 2013 | Q2 | 0 |
| 2013 | Q3 | 300 |
| 2013 | Q4 | 350 |
| 2014 | Q1 | 500 |
| 2014 | Q2 | 0 |
| 2014 | Q3 | 400 |
| 2014 | Q4 | 700 |
| 2015 | Q1 | 400 |
| 2015 | Q2 | 700 |
Dataset 3:
| Order Date | Product | Retailer | Number of orders |
| 6/5/2013 | B | Shop8 | 1 |
| 6/5/2013 | A | Shop8 | 1 |
| 6/5/2013 | B | Shop4 | 1 |
| 6/5/2013 | A | Shop6 | 1 |
| 6/5/2013 | B | Shop5 | 1 |
| 6/6/2013 | A | Shop3 | 1 |
| 6/7/2013 | B | Shop6 | 1 |
| 6/7/2013 | B | Shop5 | 1 |
| 1/1/2014 | B | Shop2 | 1 |
| 1/1/2014 | B | Shop4 | 1 |
| 1/1/2014 | A | Shop6 | 1 |
| 1/3/2014 | A | Shop5 | 1 |
| 1/2/2014 | B | Shop5 | 1 |
| 1/2/2014 | A | Shop5 | 1 |
Scenario 1: Full Outer Join
Goal: compare my regional sales figures with the global sales figure
Start by importing Dataset 1 into Lumira (You can copy each dataset from this blog to your clipboard and import it to Lumira using the Copy from Clipboard connection option. Choose delimited by "Tab" for the content to be identified correctly).

Select crosstab as the visualization and place Region in Rows feeder and the Sales measure in the Measures feeder

Import Dataset 2 and add the Global Sales measure into the Measures feeder

You are prompted to link the datasets. Link the Dataset 1.Year dimension with the Dataset 2.Year dimension.

Lumira prompts you to add the linked dimension to the visualization. Click OK to allow the tool to add Year to the Rows feeder.

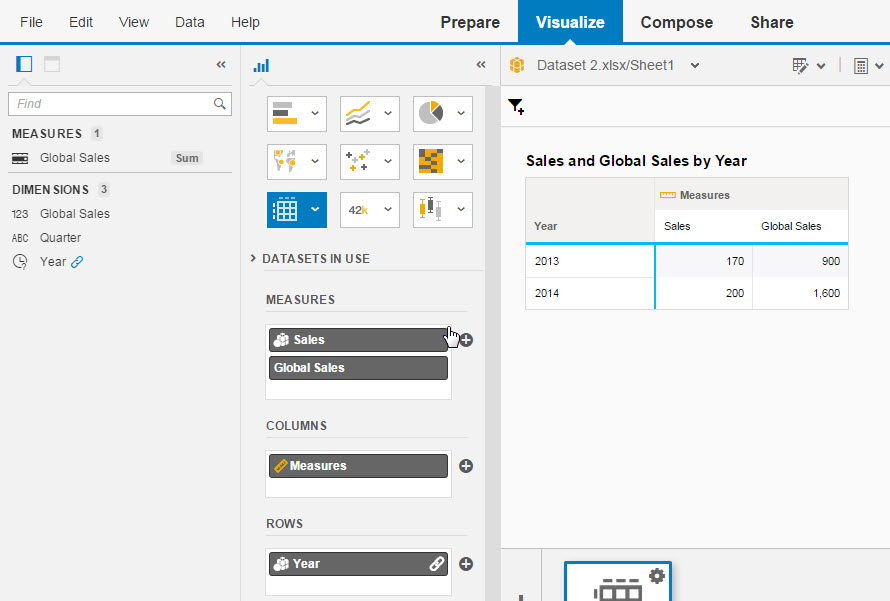
Now the crosstab displays a breakdown of Sales and Global sales by Region and Year.

Notice how the values of Global Sales are repeating for 2013 and 2014. This is because this measure can not be broken down in a unique manner by Region.
You can link additional common dimensions to achieve the desired granularity, but since this is not possible with the sample datasets that I have provided, I will remove Region from the visualization to remove the duplication.
To include 2015 Sales figures from Dataset 2 into the visualization, expand the Datasets in Use drop down and change the join type from Left outer to Full outer join.

You are now able to correlate regional sales with the Global sales side by side.

Scenario 2: Linking three datasets and Inner Join
Goal: determine the Number of orders vs. the regional and Global Sales
Add Dataset 3.

Place the Number of orders measure in the Measure feeder.

Once again, you are prompted to link the datasets. In the Dataset Linking dialog, link Dataset 1.Product dimension with Dataset 3.Product dimension.

Again , you are prompted to include Product dimension in your visualization. Click OK to continue.
Change Dataset 3 link to Inner join to remove duplicating Global Sales values.

You are now able to display measures from three different datasets in a single visualization.

Scenario 3: Secondary dimensions
Goal: calculate the Year over Year running sum of Orders by Retailer
Place the Retailer dimension from Dataset 3 in the Rows feeder of the crosstab.

Since the Retailer dimension is not from the primary dataset (Dataset 1) and is not a linked dimension, SAP Lumira rolls up its members to avoid showing duplicate values for Sales and Global Sales.

To see the Retailer breakdown, select "Show Multiple Matching Members" from the Setting cog menu

You can see that only certain Retailers have more than one order per Product.

Since I'm interested in the Year over Year Number of orders, we need to adjust the links with Dataset 3 to include the Order date to better improve the granularity of the link.
First, we will enrich the Order date to generate a date hierarchy. This process generates a year dimension in Dataset 3 that we can use to link on.

Adjust the link between Dataset 1 and Dataset 3 to include Year (From the Data menu, select Linking Datasets, then in the Linking Datasets dialog, insure that Dataset 3 is selected in the right panel)

Notice how the inner join on Year and Product adjusted the result to include only 3 Retailers per Year and Product rather than 4 and 5 respectively.

Create a running total of Number of orders per Year by opening the Running calculations dialogue box from the Calculator icon.

In the running Calculation dialog, select Number of orders as the measure, Sum as the Running Kind, and Year as the dimension to reset at.

Notice how the running sum accumulates and resets per Year.

If on the other hand, if you want to see the running total of all the orders in Dataset 3, then change the link of Dataset 3 from Inner Join to Full outer join.

Now the Number of orders displays as 8 for 2013 and as 6 for 2014.
In the image above I deselecting the Show Multiple Matching members from the Setting Cog for a more concise result; however, this is optional and the result of the running sum will still be the same per Year.
Keep an eye out for additional blogs on this topic as I will shortly share additional enhancements to Dataset linking that are planned for the 1.29 release.
- SAP Managed Tags:
- SAP Lumira
11 Comments
You must be a registered user to add a comment. If you've already registered, sign in. Otherwise, register and sign in.
Labels in this area
-
ABAP CDS Views - CDC (Change Data Capture)
2 -
AI
1 -
Analyze Workload Data
1 -
BTP
1 -
Business and IT Integration
2 -
Business application stu
1 -
Business Technology Platform
1 -
Business Trends
1,658 -
Business Trends
93 -
CAP
1 -
cf
1 -
Cloud Foundry
1 -
Confluent
1 -
Customer COE Basics and Fundamentals
1 -
Customer COE Latest and Greatest
3 -
Customer Data Browser app
1 -
Data Analysis Tool
1 -
data migration
1 -
data transfer
1 -
Datasphere
2 -
Event Information
1,400 -
Event Information
66 -
Expert
1 -
Expert Insights
177 -
Expert Insights
299 -
General
1 -
Google cloud
1 -
Google Next'24
1 -
Kafka
1 -
Life at SAP
780 -
Life at SAP
13 -
Migrate your Data App
1 -
MTA
1 -
Network Performance Analysis
1 -
NodeJS
1 -
PDF
1 -
POC
1 -
Product Updates
4,577 -
Product Updates
344 -
Replication Flow
1 -
RisewithSAP
1 -
SAP BTP
1 -
SAP BTP Cloud Foundry
1 -
SAP Cloud ALM
1 -
SAP Cloud Application Programming Model
1 -
SAP Datasphere
2 -
SAP S4HANA Cloud
1 -
SAP S4HANA Migration Cockpit
1 -
Technology Updates
6,873 -
Technology Updates
423 -
Workload Fluctuations
1
Related Content
- Harnessing Multi-Model Capabilities with Spotify – Processing Semi-Structured Data with SAP HANA Cloud/SAP Datasphere – Part 6 in Technology Blogs by SAP
- A Guide to Advanced RAG Techniques for Success in Business Landscape in Technology Blogs by SAP
- Using Build Apps to Create a List Report with Charts ,Tables and Pagination in Technology Blogs by SAP
- Unveiling SAP BusinessObjects BI 4.3 SP04 ! in Technology Blogs by SAP
- Generative AI for SAP. Part V: Models and Knowledge Graphs (KG) in Technology Blogs by Members
Top kudoed authors
| User | Count |
|---|---|
| 40 | |
| 25 | |
| 17 | |
| 14 | |
| 8 | |
| 7 | |
| 7 | |
| 7 | |
| 6 | |
| 6 |