- SAP Community
- Products and Technology
- Technology
- Technology Blogs by SAP
- Step by Step to use VisualVM to do performance mea...
- Subscribe to RSS Feed
- Mark as New
- Mark as Read
- Bookmark
- Subscribe
- Printer Friendly Page
- Report Inappropriate Content
Recently I am trying to find a handy tool to measure the performance of my Java application and finally I think the VisualVM provided by JDK is the ideal one. This blog is written based on JDK1.7 + Eclipse 4.3.2.
What is VisualVM
It is a tool automatically available after JDK is installed. The executable file could be found on your <JDK installation folder>/bin as displayed below.

In order to measure the performance of your application, it is necessary for the application to be recognized by VisualVM first.
There is a plugin named "VisualVM launcher for Eclipse" which can help us about it.
Install and configure VisualVM launcher
1. download the zip from http://visualvm.java.net/eclipse-launcher.html. Unzip the file and put it to the plugin folder of your Eclipse installation folder. In my laptop it looks like below. There should be a site.xml inside the unzipped folder.

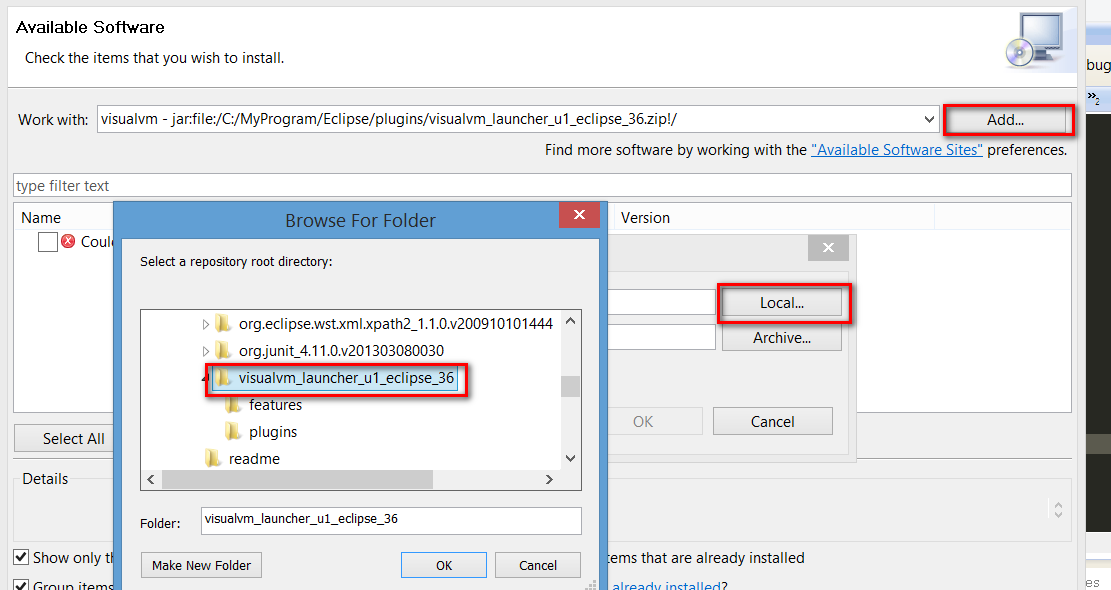
2. In Eclipse, choose menu "Help->Install New Software", click "Local", add locate the folder to the one you finish in step1.

Then the local downloaded plugin is successfully parsed and ready for install.

finish the installation.

3. Restart Eclipse, then you can find a new option via the path below. Configure two paths accordingly.

For "JDK Home", if you configure the JRE path by mistake, later when you try to measure your application, the VisualVM will fail to load with the following error message:

Now the plugin is ready to use.
Do performance measurement
1. Select your Java project, choose context menu "Run as"->"Run configuration", create a new Application configuration by specifying VisualVM launcher as its launcher, instead of the default Eclipse JDT launcher.

2. For example I have a Java application which sorts an array by QuickSort algorithm written by myself and I would like to get its performance data, then I set a breakpoint on line 57, before my main logic is executed.
Then launch the application in debugging mode with the application configuration created in previous step.
Afterwards VisualVM will automatically be launched and successfully recognize the execution of my application.
Click Profiler tab:

Current status: profiling inactive. Click CPU button:

Now profiling is activated:

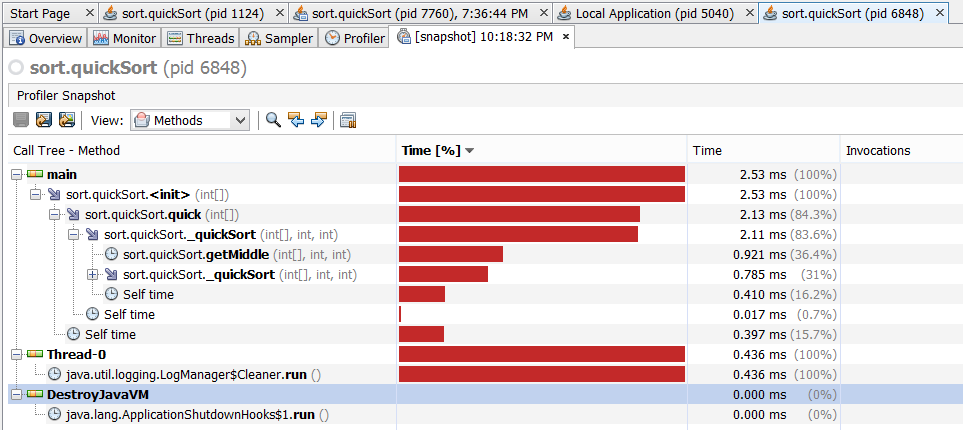
3. Go back to Eclipse and click F8 to finish execution. Once finished, VisualVM will immediately capture this event and notify you. Just click Yes to get performance result.

The result is displayed as below:

- SAP Managed Tags:
- Java,
- SAP NetWeaver,
- SAP NetWeaver Application Server for Java
You must be a registered user to add a comment. If you've already registered, sign in. Otherwise, register and sign in.
-
ABAP CDS Views - CDC (Change Data Capture)
2 -
AI
1 -
Analyze Workload Data
1 -
BTP
1 -
Business and IT Integration
2 -
Business application stu
1 -
Business Technology Platform
1 -
Business Trends
1,658 -
Business Trends
91 -
CAP
1 -
cf
1 -
Cloud Foundry
1 -
Confluent
1 -
Customer COE Basics and Fundamentals
1 -
Customer COE Latest and Greatest
3 -
Customer Data Browser app
1 -
Data Analysis Tool
1 -
data migration
1 -
data transfer
1 -
Datasphere
2 -
Event Information
1,400 -
Event Information
66 -
Expert
1 -
Expert Insights
177 -
Expert Insights
296 -
General
1 -
Google cloud
1 -
Google Next'24
1 -
Kafka
1 -
Life at SAP
780 -
Life at SAP
13 -
Migrate your Data App
1 -
MTA
1 -
Network Performance Analysis
1 -
NodeJS
1 -
PDF
1 -
POC
1 -
Product Updates
4,577 -
Product Updates
342 -
Replication Flow
1 -
RisewithSAP
1 -
SAP BTP
1 -
SAP BTP Cloud Foundry
1 -
SAP Cloud ALM
1 -
SAP Cloud Application Programming Model
1 -
SAP Datasphere
2 -
SAP S4HANA Cloud
1 -
SAP S4HANA Migration Cockpit
1 -
Technology Updates
6,873 -
Technology Updates
420 -
Workload Fluctuations
1
- Benchmarking in the data-driven era in Technology Blogs by SAP
- Workload Analysis for HANA Platform Series - 1. Define and Understand the Workload Pattern in Technology Blogs by SAP
- The What Is... The Why To... The How To... of: ESG & SAP & Enterprise Blockchain 🚀 in Technology Blogs by Members
- Boosting Business Performance: Measuring ROI in BPM in Technology Blogs by SAP
- Fast Track your AI Strategy with SAP Business AI in Technology Blogs by SAP
| User | Count |
|---|---|
| 36 | |
| 25 | |
| 17 | |
| 13 | |
| 8 | |
| 7 | |
| 6 | |
| 6 | |
| 6 | |
| 6 |