I'll share here a little trick we have in Planviz perspective since SP08. Although this is far from a new trick I'm getting surprised everyday by the amount of people working in HANA related projects (HANA Live customizations, Native development, and so on…) that didn’t know that.
I took a scenario we had a few weeks back here at SAP Labs just as an example for this post. Basically a query was not performing that well so we could reproduce the issue on a separate box and verify what was going on. I don’t want to focus on the query itself, nor in the underlying models used by it. However, just to give an overall idea, the query was on top of a Scripted Calculation View that used other Graphical Calculation Views within it.
This was using a few filters like: documents from Company code (=’1000’), Branch (= ‘U007’) and Document Date (April 2010). Something like:

So, to start off, how do you get to know the tables involved on your query execution? Those can be found in the ‘Tables Used’ View in Planviz perspective. That view will provide you all tables used (persisted and internal) by the plan operators of your query execution.
For each table you have there, the very first column of that view gives you the maximum amount of entries processed by each table on one of the plan operators. It’s important to notice that the term ‘entries’ here does not always mean the number of records. Some operators will request the dictionary values of a column and that will be counted as entries as well.

If you double click on a table under Tables Used view you’ll be redirected to the Operator List view – yet another super useful view under the Planviz perspective. That view contains some very interesting information regarding the query execution. And now that you filtered the table of interest, all operators are related to your table only :wink:
Here’s what it looks like when I double click on table J_1BNFDOC in my scenario:

There are many interesting columns here. For now, let’s give special attention to Input Rows and Output Rows. Despite the word ‘Rows’, values find there does not always have that meaning. I believe these can be interpreted as entries as well. However, for some operators, the ‘Rows’ term will mean actually records from the tables. By looking at the ones that does not have input rows and output a number of rows > 0 you have a better chance to see actual filtering at table level (specially in *Predicate operators). You can quickly check that by setting the ‘n/a’ value under the ‘Input Rows’ equal filter. Here’s the output in my scenario:

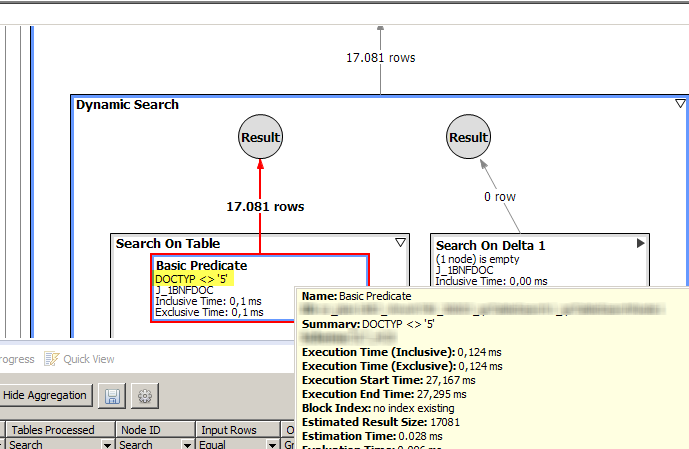
So now we have a starting point to check whether we’re really dealing with the amount of records that we’re supposed to be dealing with. We can ask questions such as: should I be using 17.081 records for my query? Are my filters being used or not?
Strangely some of the expected filters applied in the original query were not being used in the J_1BNFDOC table as expected. Company Code (BUKRS), Branch and document date were not showing up as basic predicates in the Planviz. Only DOCTYP <> ‘5’ was executed (which turned out to be an explicit filter done in one of the underlying Graphical Calc Views).
Checking the table directly confirmed the information.

So we should be looking a maximum of 591 rows instead of 17,631 from that particular table.
In this scenario we later discovered that the code behind the query (scripted calc view on top of graphical calc view) was neither using where clauses nor any input parameter placeholders to try filtering out the underlying calculation views. Development was assuming these were going to be pushed down automatically to the SQL on the variable assignments in the script.That might even work for some simpler scenarios, but clearly not for this. It is often difficult to guarantee that this will always hold. Unless you explicitly force it within your code (if you use Scripted CVs of course).
So the suggestion to overcome this scenario to either adapt the code so that all filters are applied or switch to pure Graphical Calculation View usage.
They have actually decided to reconstruct the whole thing making use of Graphical Calculation Views solely. Kind of like the way HANA Live views works (mostly): making usage of SQL Engine; better separation of models; usage of left/right outer joins whenever possible; cardinality defined where needed and so on..
After the changes, filters started to be pushed down nicely. View Tables Used is now presenting sensible numbers:

Max entries processed for other tables lowered significantly as well (due to the joins involved in the model).
However, it is important to remind that 'entries' not always means rows. But we can double check that in the Operator List view.
For the central table J_1BNFDOC this is what happened:

So now we can say that we're not dealing with more than 501 rows and the filters were applied nicely: started with the branch filter, passed to the document date filter and finally got to the company code filter. All good now :smile:
And just to make a super short summary of this whole thing, here are the steps to get to your filters:
- Generate planviz for the query
- Go to Tables Used view
- Double click the table you want to check filtering
- Set value ‘n/a’ on ‘Input Rows’ filter on Operators List view
- Check other possible filters upwards (in the graph view) and get the number of records your query is using from that table.
- Finally, ask yourself if your query is really processing the exact amount of records that you should be processing :wink:
I hope that can help you guys in the future.
PS.: a big big thank you to roberto.falk who immensely helped in this scenario. Thanks man!
BRs,
Lucas de Oliveira
