Product Lifecycle Management Blogs by SAP
Dive into product lifecycle management news, learn about digitalizing PLM for the digital supply chain, and stay informed with product updates from SAP.
cancel
Showing results for 
Search instead for 
Did you mean: 
former_member182779
Active Contributor
0 Kudos

If you are an SAP Employee, please follow us on Jam.


At the d-shop we're always looking forward to play with the latest technologies...a while the Nest Thermostat is not really "new", we're in the process of getting one.


For now, we are happy to be able to play a little bit with Nest Home Simulator available on the Google Chrome Store.


In this blog, we're going to use the Nest Home Simulator, the Statistics Programming Language R and the Shiny package, which allows us to create awesome web interfaces to manage data. Also, we're going to need the RJson package.


First step will be to create an account on the Nest Developer Program and the install the Nest Home Simulator.


Wen we log into the Simulator, we are going to be able to create a Thermostat to start playing around with the current and target temperatures...


The second important thing, is that when we are log into the Nest Developer Program we're going to be able to create a client which will access our thermostat and also, we will going to able to generate a unique number to communicate with it.


We need to just copy and paste the URL from the Authorization URL and after accepting the conditions a number will be presented...we need this number for our R code...but keep in mind that once the connection is closed, we will need to generate a new number...


Now, we're ready to add some code to the mix...when working with R, is always better to use RStudio...so copy and paste this code...and remember to replace the code variable with your own number...also you will need to replace the Client ID and Client Secret with the information from your Nest Developer Program Client code...


Nest_Dashboard.R

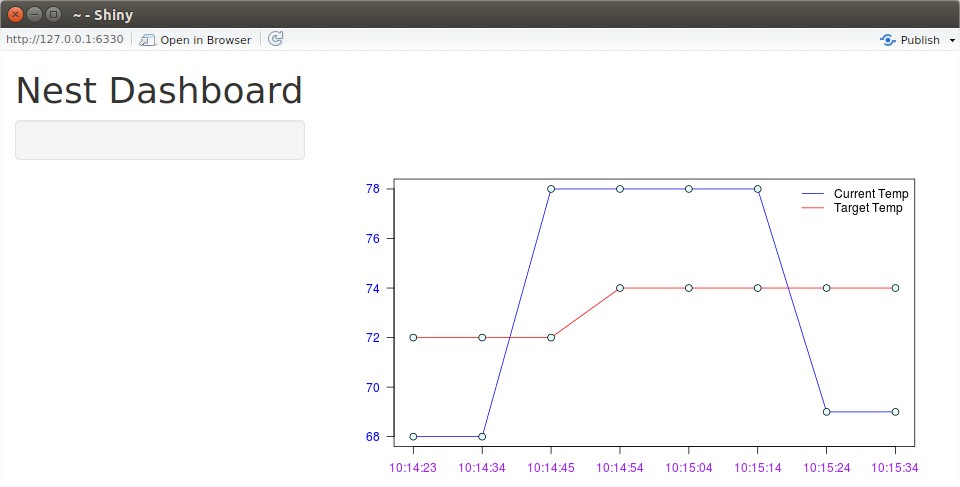
library("shiny")

library("rjson")

if(!exists("access_code")){

  code<-"XXXXXX"

  info_data<-data.frame(Humidity=integer(),Current_Temperature=integer(),Target_Temperature=integer(),Times=character())

  access_code<-system(sprintf('curl -X POST "https://api.home.nest.com/oauth2/access_token?client_id=XXX=%s&client_secret=XXX&grant_type=authoriz..."',code),intern=T)

  document<-fromJSON(access_code)

  access<-document$access_token

  devices<-paste("https://developer-api.nest.com/devices?auth=",access,sep="")

  all_devices<-system(sprintf('curl -L -X GET -H "Accept: application/json" "%s"',devices),intern=T)

  device<-gsub("thermostats|:|{|\"|humidity.*","",all_devices,perl=T)

  themostat_code<-paste("https://developer-api.nest.com/devices/thermostats/",device,"?auth=",access,sep="")

}

get_nest_info = function(info_data){

    thermostat<-system(sprintf('curl -L -X GET -H "Accept: application/json" "%s"',themostat_code),intern=T)

    info<-fromJSON(thermostat)

    timeframe<-Sys.time()

    timeframe<-gsub("\\d+-\\d+-\\d+\\s","",timeframe)

    new_data<-data.frame(Humidity=info$humidity,Current_Temperature=info$ambient_temperature_f,Target_Temperature=info$target_temperature_f,Times=timeframe,stringsAsFactors = F)

    if(nrow(info_data)==10){

      info_data<-info_data[-1,]

    }

    info_data<-rbind(info_data,new_data)

  return(info_data)

}

runApp(list(

  ui = pageWithSidebar(  


    headerPanel("Nest Dashboard"),


    sidebarPanel(

    ),


    mainPanel(

      plotOutput("nestPlot")

    )

  ),

  server =function(input, output, session) {

    autoInvalidate <- reactiveTimer(10000, session)

      output$nestPlot <- renderPlot({

        autoInvalidate()

        info_data<<-get_nest_info(info_data)

        plot(info_data$Current_Temperature,type="n",axes=F,ann=F)

        lines(info_data$Current_Temperature,col="blue")

        lines(info_data$Target_Temperature,col="red")

        points(info_data$Current_Temperature, pch=21, bg="lightcyan", cex=1.25)

        points(info_data$Target_Temperature, pch=21, bg="lightcyan", cex=1.25)

        box()

        xy<-length(info_data$Times)

        axis(2, col.axis="blue", las=1)

        axis(1, at=1:xy, lab=info_data$Times, col.axis="purple")

        legend("topright",c("Current Temp","Target Temp"),lty=c(1,1),col=c("blue","red"),bty="n")

    })

  }

))


This code will get 10 readings until it refreshes itself to get 10 new ones. So we can update the Current and Target Temperature values in order to see the Dashboard changing...


Top kudoed authors