As mentioned by title, this blog does not introduce the OData trace functionality itself, but shows the way how to find and figure out the usage of trace functionality by yourself, for example, find the corresponding transaction code or report name to launch the trace.
Actually this approach is not dedicated to gateway but generically applies to any other scenario:
- You have found switch or flag evaluation in some ABAP source code which dynamically controls the enablement of certain functionality. You need to know where and how you can access this switchable function.
For example, in gateway system, I found there are two flags which enable or disable the OData trace:

I need to find out how to perform the OData trace by the source code, without any debugging in the runtime.
Step1: perform where-used-list on mv_perf_level:

7 hits. Based on experience, I can judge that the line 100 is fill it with value fetched from DB table via open SQL.
Double click the line 100.

Step2: Now I found the configuration table which stores the trace configuration information. Perform where-used-list on the table again:

The second report, /IWFND/SUTIL_TRACE_CONFIG, is what I am looking for, the one to launch OData trace UI.

To verify, simply execute it. And that's it. After I made the following setting and click save button:

There is corresponding entry persisted in the table I found in this step.

Step3: I am also curious about at what time the other flag, mv_odata_trace_active, could become true. Still the same approach.
Check the result. Based on experience, only the first method ENABLE_ODATA_TRACE performs the write access on the flag, all the left are read access such as IF mv_odata_trace_active = abap_true. ....

Double click on ENABLE_ODATA_TRACE, and we get to know the flag will become true if io_context->debug is true.

So now research /IWCOR/IF_DS_CNTXT instead:

Again the attribute DEBUG of interface only has the opportunity to be true in the constructor method of the implementation class, all other 41 hits are the read access on it and could be ignored.
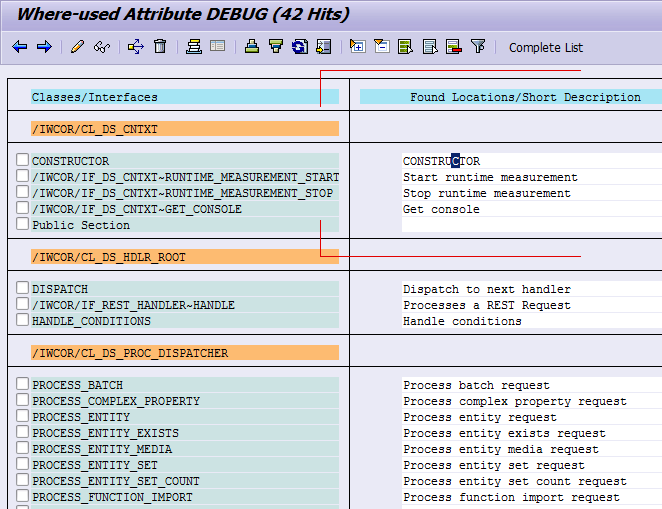
so perform the where-used-list on constructor method:

Here we are very near to the target:

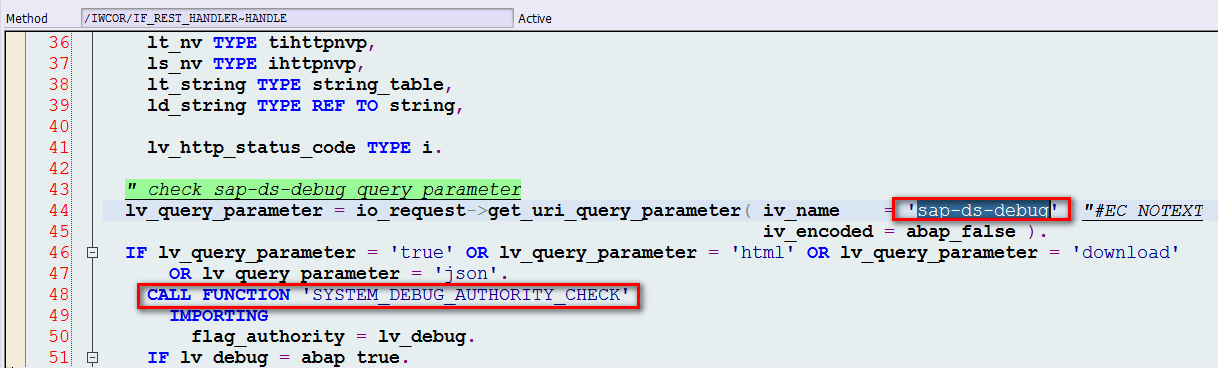
Just scroll up, and we get the result. The other flag could only become true when the two prerequisites are met:
1. There is query parameter sap-ds-debug defined in the OData request url.
2. The current user should have debug authorization, that is, should pass the check by function module SYSTEM_DEBUG_AUTHORITY_CHECK.