Hi All,
In this Blog, I would like to show you, how to measure the Performance of Design Studio Application and breakdown the steps.
This is also mentioned in SAP Note 2162616. But here I am showcasing with an example.
Before that, please be aware of these terms,
- Design Studio Processing Time - Net time spent by Design Studio processing excluding Remote, Platform Overhead, and Residual Time
- Remote Time - Time spent for data retrieval on HANA or BW backend systems. UNX systems are not covered by this procedure yet
- Platform Overhead Time - Time spend on BIP or NW platform
- Residual Time - Network, latency, JavaScript processing, CSS parsing, HTML rendering, etc.
- Total Time - Total of the above times
Prerequisites :
- Design Studio 1.5
- Design Studio application deployed on platform (BIP or NW)
- Browser (Internet Explorer, Chrome, etc.)
- Fiddler (HTTP traffic monitor)
- Microsoft Excel
Here are the Steps :
1. Start Fiddler (You can download from http://www.telerik.com/download/fiddler/fiddler4)
2. In Design Studio, capture the URL of the application which you designed, through the following step
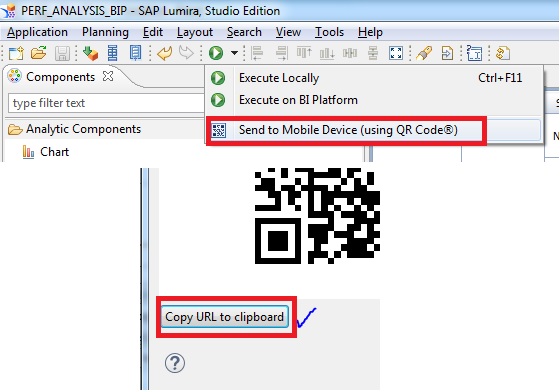
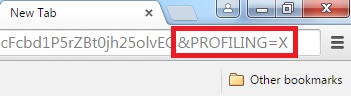
3. Copy the URL into the browser and add "&PROFILING=X" at the end of the URL in the browser and hit enter
4. Wait until the Design Studio application has been completely rendered in the browser
5. In the Fiddler log, select all HTTP requests of the Design Studio HTTP traffic

6. In Fiddler, select the "Statistics" tab and write down the value of "Sequence (clock) duration". This is the Total Time of the Design Studio application (T1) which is 6.092 seconds
T1 = 6.092 seconds

7. In the Fiddler log, select all HTTP requests up to the first HTTP request containing the string
"/zenwebclient/" in its URL for the BIP platform
"/com.sap.ip.bi.designstudio.nw.portal.launcher/" in its URL for the NW platform
And note down the "Sequence (clock) duration". This is the Platform Overhead Time (T2)
T2 = 1.332 seconds

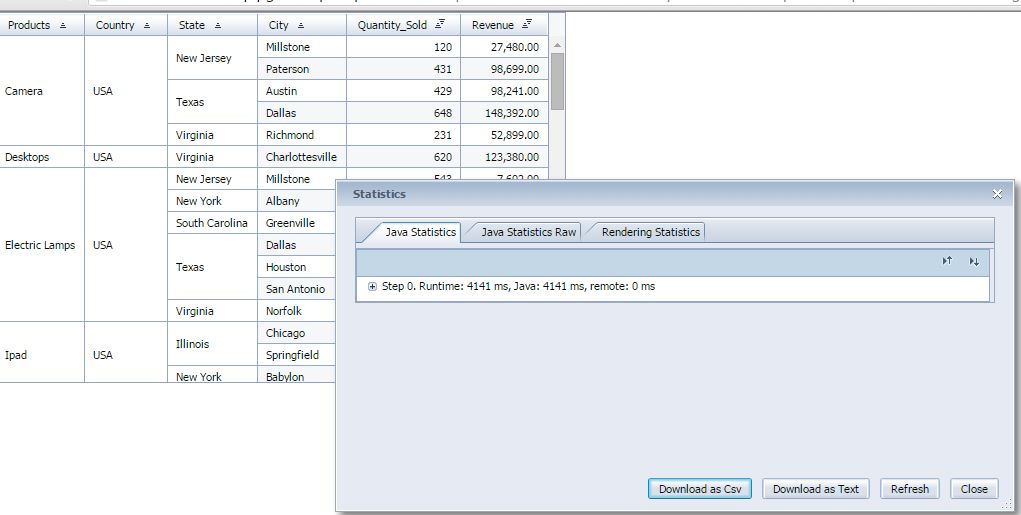
8. In the Profiling dialog, select the "Java Statistics" tab and click the "Download as CSV" button and download the statistics results

9. Open the downloaded file in Microsoft Excel

10. In Microsoft Excel, activate filtering by selecting "Home > Sort & Filter > Filter" and locate the column "Type" and apply the filter value "STEP"
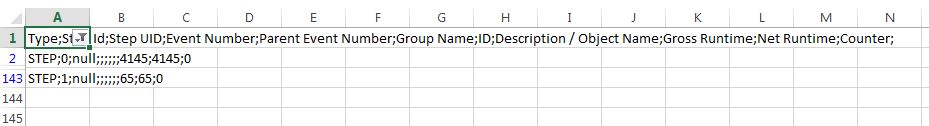
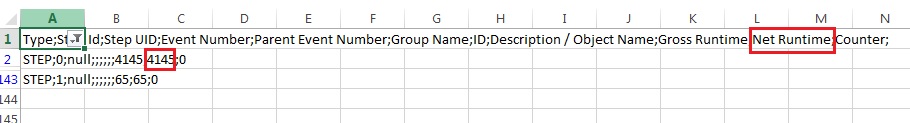
11. Locate the column "Net Runtime" and add all but the last value in this column. Write down this value. This is the Design Studio Processing Time (T3) . The last value is caused by the button click and therefore discarded
T3 = 4145 ms or 4.145 seconds
12. Locate the column "Counter" and add all but the last value in this column. Write down this value. This is the Remote Time (T4). The last value is caused by the button click and therefore discarded.
T4 = 0

13. Calculate the Residual Time (T5). [T5 = T1 – T2 – T3 – T4]
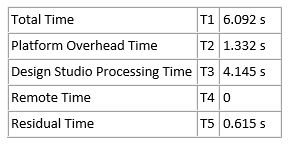
14. With the values T1 to T5 you can break down the result of your performance measurement as follows:
If you want to measure the performance of a Design Studio application with an empty browser cache you must clear the browser cache before you start the measurement procedure
Hope this help you :-).
Please share your comments.
Rgds,
Murali
