- SAP Community
- Products and Technology
- Technology
- Technology Blogs by SAP
- DataGeek - Previous Entries
- Subscribe to RSS Feed
- Mark as New
- Mark as Read
- Bookmark
- Subscribe
- Printer Friendly Page
- Report Inappropriate Content
DATAGEEK - Previous Entries
Download Data Samples | DataGeek Example Library
PREVIOUS ENTRIES
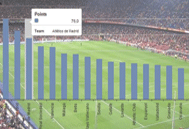
Analyzing Spanish Football League using SAP Lumiraby carlos.pintocamarero
| Analyzing flight delays with SAP Lumiraby julien.delvat2
|
Analyzing Workforce distribution Report with SAP Lumira - The BI Revoultion
Author: p056701varun.mankodi
Varun analyzes workforce distribution reports with SAP Lumira. See how easy he finds out the product works!
ST22 Dump Analysis using SAP Predictive Analysis
Author: muralikrishnan.erahul.mahajan
Using SAP Predictive Analysis Rahul has some unanswered questions about dumps (code term).
See if he was able to solve them!

World's Top 10 Software Companies
Author: Konstantin Anikeevharisuseelan
Using SAP Lumira application, Suseelan has generated some graphical representations which shows top 10 software companies ranked by annual revenue & software revenue.
View more examples in the Data Geek Library
Predicting Tour de France stage wins using SAP Predictive Analysis
Author: dirk.kemper3
Do you think you can predict who will win the Tour De France?
Dirk uses SAP Predictive Analysis to see how a spectator could go about doing so!

Let's Predict Olympics - Rio 2016 Part-1
Author: durgamadhab.mishra
The 2016 Rio Olympics are only a few years away!
Durgamadhad uses SAP Predictive Analysis to predict the winners of the Olympics.
View more examples in the Data Geek Library

Analyzing Smartphone Platforms Sales Per Quarter
Author: rafael.zanetti
Using SAP Lumira, Rafael shows us which smartphone platforms sell the most per quarter!

World's Top 10 Software Companies
Author: Hari Suseelan
Want to know who the world's top 10 software companies are?
Here, Hari generated some graphical representations which shows the top 10 software companies ranked by annual revenue & software revenue.

Data Geek Challenge: Analyzing High-Technology exports (SAP Predictive Analysis)
Author: jerry.zhang4
Which countries export the most high-technology today, and which will export the most in the future?
Jerry answers these questions using SAP Predictive Analysis
View more examples in the Data Geek Library

Analysing Population Growth in Australia over last decade
Author: amlan.banerjee
What is the trend of the population growth in Australia over the last decade? Which States contribute to the population trends? Using data from the Australian Bureau of Statistics, Amlan tries to find answers using SAP Lumira.

Analyzing US gun crime statistics using SAP Lumira
Author: pradeep.kumar5
Using the latest data from FBI Uniform crime reports, Ganugapenta analyzes US gun crime stats using SAP Lumira.

The Cause and Effect of Increase in Motor Vehicles
Author: vamsikrishnareddy.kakuru
After his recentnly becoming a owner of a 2 wheeler vehicle, Vamsi got interested to analyze the cause and effect of increase in motor vehicles. Check out his experience!
View more examples in the Data Geek Library

Can you reduce the risk of cancer by changing Habits
Author: durgamadhab.mishra
Durgamadhab wants to see if there is any correlation of a food habit and exercise with breast cancers in females in the US aged 16-64. See what he finds out using SAP Lumira!

Evaluating the number of Hybrid Cars between 2007 and 2012
Author: thiago.luttig
Do you have a hybrid car?
Yathish evaluates the number of Hybrid cars between 2007 and 2012.

HIV prevalence around the world
Author: nameethmithunsandeep.korlepara
At the end of 2011, an estimated 34 million people were living with HIV worldwide, with two-thirds of them living in sub-Saharan Africa. Mithun has collected the data of HIV pervalence in all the counties for the last 35 years and tries to analyze it using SAP Lumira!
- SAP Managed Tags:
- SAP Lumira
You must be a registered user to add a comment. If you've already registered, sign in. Otherwise, register and sign in.
-
ABAP CDS Views - CDC (Change Data Capture)
2 -
AI
1 -
Analyze Workload Data
1 -
BTP
1 -
Business and IT Integration
2 -
Business application stu
1 -
Business Technology Platform
1 -
Business Trends
1,658 -
Business Trends
93 -
CAP
1 -
cf
1 -
Cloud Foundry
1 -
Confluent
1 -
Customer COE Basics and Fundamentals
1 -
Customer COE Latest and Greatest
3 -
Customer Data Browser app
1 -
Data Analysis Tool
1 -
data migration
1 -
data transfer
1 -
Datasphere
2 -
Event Information
1,400 -
Event Information
66 -
Expert
1 -
Expert Insights
177 -
Expert Insights
299 -
General
1 -
Google cloud
1 -
Google Next'24
1 -
Kafka
1 -
Life at SAP
780 -
Life at SAP
13 -
Migrate your Data App
1 -
MTA
1 -
Network Performance Analysis
1 -
NodeJS
1 -
PDF
1 -
POC
1 -
Product Updates
4,577 -
Product Updates
344 -
Replication Flow
1 -
RisewithSAP
1 -
SAP BTP
1 -
SAP BTP Cloud Foundry
1 -
SAP Cloud ALM
1 -
SAP Cloud Application Programming Model
1 -
SAP Datasphere
2 -
SAP S4HANA Cloud
1 -
SAP S4HANA Migration Cockpit
1 -
Technology Updates
6,873 -
Technology Updates
423 -
Workload Fluctuations
1
- Analyze Expensive ABAP Workload in the Cloud with Work Process Sampling in Technology Blogs by SAP
- 10+ ways to reshape your SAP landscape with SAP BTP - Blog 4 Interview in Technology Blogs by SAP
- Consuming SAP with SAP Build Apps - Connectivity options for low-code development - part 2 in Technology Blogs by SAP
- Explore Business Continuity Options for SAP workload using AWS Elastic DisasterRecoveryService (DRS) in Technology Blogs by Members
- SAP SABRIX UPGRADE in Technology Blogs by Members
| User | Count |
|---|---|
| 40 | |
| 25 | |
| 17 | |
| 14 | |
| 8 | |
| 7 | |
| 7 | |
| 7 | |
| 6 | |
| 6 |


