
- SAP Community
- Products and Technology
- Enterprise Resource Planning
- ERP Blogs by Members
- Debugging for Functional Consultants
Enterprise Resource Planning Blogs by Members
Gain new perspectives and knowledge about enterprise resource planning in blog posts from community members. Share your own comments and ERP insights today!
Turn on suggestions
Auto-suggest helps you quickly narrow down your search results by suggesting possible matches as you type.
Showing results for
former_member19
Active Contributor
Options
- Subscribe to RSS Feed
- Mark as New
- Mark as Read
- Bookmark
- Subscribe
- Printer Friendly Page
- Report Inappropriate Content
05-26-2015
3:43 AM
Introduction to Debugging
SAP consists for various transactions codes and data. Data are stored in the tables and the transaction codes have ABAP programs at the back end. Literal meaning of debugging is ,to make something(a program in current discussion) bug-free. But that is just one aspect of debugging.
Through debugging, we can analyze a program, understand the flow logic and most importantly find out the root cause to any issue .Although Debugging is the obvious task of an ABAP consultant, the debugging knowledge would be of great help to functional consultants. It will save their time for analysis and issue resolution , reduce over-dependence of ABAP team , help in effort estimation.
Let's look at the different aspects of debugging. We will divide the discussion in to the below parts.
1. Programs in SAP ABAP
2. Initiating the Debugging
3. Breakpoints
4. General tips
1. Programs in SAP ABAP
As functional consultants, we deal with many transaction codes and behind each transaction code, there is a ABAP source code. It can be either SAP delivered or customized code, written by ABAP consultant for specific need.
When we execute the program, the control runs through the program and delivers the output. When we debug, the control remains in our hand and runs through the program line by line, thereby allowing us to find out a specific bug, or clarity about a specific logic.
2. Initiating the Debugging
Debugging can be initiated in two ways.
a. Using /h command and executing the transaction.
b. Putting a break-point, at a particular line of the program and executing
the transaction.
As functional consultants , we would be mostly using the 1st option. The 2nd option is used, generally by ABAPers, where they want to see the behavior of a particular section of the code. Let's see examples of each of the above mentioned methods.
Example
a. Using /h command and executing the transactions
Below is the initial screen of a transaction.

First step is to use the command '/h'.

A message will be displayed in the bottom of the screen.
The resulting Screen will be as below.
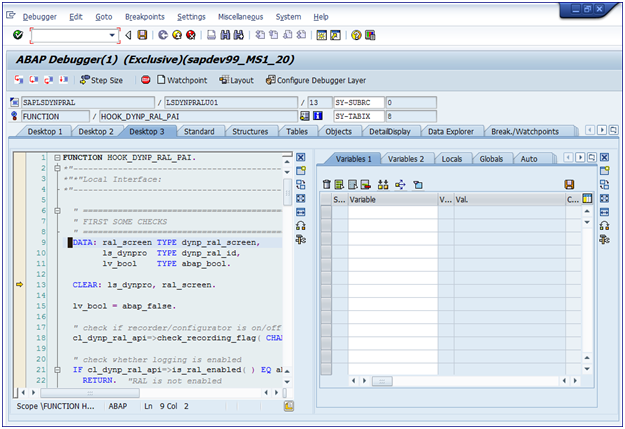
We can see the current control with the yellow arrow.
- As we press ‘F5’, the control proceeds further.
- If we press F8, two things can happen
1. If any Break-point is there, the control will directly flow there.(Break-Points have been discussed in more detailed way in coming slides)
2. If no break-point is there, the debugging will end and the program will get executed.
- As we move along the program, we may encounter, Subroutines/function modules, which are nothing but a piece of code within the program, which take inputs and provide a specific output.
- If we Keep pressing on F5, we will go inside the Subroutines/function modules and go through each line.
- If we have yet not entered Subroutines/function modules , then by pressing F6 , we will skip going through the code piece and the Subroutines/function module will be completely executed.
- If we have entered Subroutines/function modules , then by pressing F7 , we will come out of the code piece and the Subroutines/function module will be completely executed.
b. Putting a break-point, at a particular line of the program and executing the transaction
This can be done by going in to the source code editor (SE38/37 etc.) and putting the break point at the desired line. Cursor can be put on the particular line , at which we need the control to stop and click on the break point button(highlighted in the below screenshot).This will create the breakpoint in the program.
When we execute the program, the control will go to that point and stop.

3. Break-Points
Break-point is the point where the Program execution comes to a halt and from there on we can continue debugging or straight away execute the program , by pressing F8.
There are various ways, through which we can put a break-point in a program . Two mostly used ways are as below.
1. During Debugging the program
2. Before Debugging/Executing the program
Lets discuss about each of the ways.
1. During Debugging of the program
During debugging break point can be put in two ways.
a. Jumping to a specific processing block
This is one of the important methods and by far the most useful for functional consultants.
Generally we tend to debug, when we encounter an error message. In that case, we can put the breakpoint, exactly at the point , where the error originated. And once we execute the program, that will take us straight to that point.
Let's take an example of the current program. It takes the input as an AL11 path. The path must be a valid one. If we put an invalid one, it would ideally end in error. Suppose We encounter such an error, while executing the transaction in question.

Above is the initial screen and upon execution, we got the below error.

1st thing to do after this is double clicking the error message which will give us the message class and the message number In the screen below AD is the message class and 010 is the message number and the message, being in red, indicates that it's an error message.

We start the debugging, by using /h and then, we put this message class and number in the debugging screen as mentioned in the following screenshot.


Now executing the program(F8) will take us to the exact point of error, where we can analyze the reason of the error. In this specific case, the IF statement below says, if the 1st two characters (OFILE_SAVE+0(2)) is not '\\', then issue an error. The input that we provided in the selection screen started with '//' , and hence it resulted in error. That's how, we find out the reason of an error, in this method.

b. Using the stop icon, during debugging
Once the debugging screen appears, breakpoint can be put by using the highlighted breakpoint option.

2. Before Debugging/Executing the program
This can be done by putting a breakpoint in the source code editor (SE38/37 etc.). When we execute the program, the control will go to that point and stop.
In SE38, Cursor can be put on the particular line , at which we need the control to stop and click on the break point button(highlighted in the below screenshot).
Next when we execute the program or transaction, the control stops at this point.

4. General Tips:
Given below are some general tips, suggestions and terminologies involved in debugging.
- Debugging with the new Debugger Opens a new session. Hence , before debugging, ensure that we have enough room for the same, else, automatically the old debugger opens.
- During Debugging, if at any point, we want to see the source-code, we can do so in the following way.

- During debugging, we come across select statements, which are nothing but the statements, which fetch data from database table and store in the internal table in the run-time. If we click on the table icon(highlighted in the below screenshot) , It opens up the table in the next window. We can download the table data in an excel format for our analysis.

Below are few important parameters and terminologies with respect to debugging.
- SY-SUBRC : It's an indicator, that shows , whether the execution of a “Select statement” , “Function Module”, “Subroutine” , “Method”, is successful or not. When sy-subrc is 0, it indicates that the execution is successful.
- Variable : It’s a temporary storage parameter, that holds a value during the program run-time.
- Constant: As the name suggests, it holds a constant value, which is hard-coded in the program.
- Tables : When the control passes through a select statement, up on successful execution, the table(internal table) gets filled in the run-time.
- Structures : Structure is different than a table. Its just a template, but not a table.
These were some basic information, which can be handy to the functional consultants. Debugging has far more aspects and we can explore more of them, as we continue to be involved in more of debugging. Your comments and suggestions are most welcome.
- SAP Managed Tags:
- FIN (Finance)
54 Comments
- « Previous
-
- 1
- 2
- Next »
You must be a registered user to add a comment. If you've already registered, sign in. Otherwise, register and sign in.
Labels in this area
-
"mm02"
1 -
A_PurchaseOrderItem additional fields
1 -
ABAP
1 -
ABAP Extensibility
1 -
ACCOSTRATE
1 -
ACDOCP
1 -
Adding your country in SPRO - Project Administration
1 -
Advance Return Management
1 -
AI and RPA in SAP Upgrades
1 -
Approval Workflows
1 -
ARM
1 -
ASN
1 -
Asset Management
1 -
Associations in CDS Views
1 -
auditlog
1 -
Authorization
1 -
Availability date
1 -
Azure Center for SAP Solutions
1 -
AzureSentinel
2 -
Bank
1 -
BAPI_SALESORDER_CREATEFROMDAT2
1 -
BRF+
1 -
BRFPLUS
1 -
Bundled Cloud Services
1 -
business participation
1 -
Business Processes
1 -
CAPM
1 -
Carbon
1 -
Cental Finance
1 -
CFIN
1 -
CFIN Document Splitting
1 -
Cloud ALM
1 -
Cloud Integration
1 -
condition contract management
1 -
Connection - The default connection string cannot be used.
1 -
Custom Table Creation
1 -
Customer Screen in Production Order
1 -
Data Quality Management
1 -
Date required
1 -
Decisions
1 -
desafios4hana
1 -
Developing with SAP Integration Suite
1 -
Direct Outbound Delivery
1 -
DMOVE2S4
1 -
EAM
1 -
EDI
2 -
EDI 850
1 -
EDI 856
1 -
edocument
1 -
EHS Product Structure
1 -
Emergency Access Management
1 -
Energy
1 -
EPC
1 -
Financial Operations
1 -
Find
1 -
FINSSKF
1 -
Fiori
1 -
Flexible Workflow
1 -
Gas
1 -
Gen AI enabled SAP Upgrades
1 -
General
1 -
generate_xlsx_file
1 -
Getting Started
1 -
HomogeneousDMO
1 -
IDOC
2 -
Integration
1 -
learning content
2 -
LogicApps
2 -
low touchproject
1 -
Maintenance
1 -
management
1 -
Material creation
1 -
Material Management
1 -
MD04
1 -
MD61
1 -
methodology
1 -
Microsoft
2 -
MicrosoftSentinel
2 -
Migration
1 -
MRP
1 -
MS Teams
2 -
MT940
1 -
Newcomer
1 -
Notifications
1 -
Oil
1 -
open connectors
1 -
Order Change Log
1 -
ORDERS
2 -
OSS Note 390635
1 -
outbound delivery
1 -
outsourcing
1 -
PCE
1 -
Permit to Work
1 -
PIR Consumption Mode
1 -
PIR's
1 -
PIRs
1 -
PIRs Consumption
1 -
PIRs Reduction
1 -
Plan Independent Requirement
1 -
Premium Plus
1 -
pricing
1 -
Primavera P6
1 -
Process Excellence
1 -
Process Management
1 -
Process Order Change Log
1 -
Process purchase requisitions
1 -
Product Information
1 -
Production Order Change Log
1 -
Purchase requisition
1 -
Purchasing Lead Time
1 -
Redwood for SAP Job execution Setup
1 -
RISE with SAP
1 -
RisewithSAP
1 -
Rizing
1 -
S4 Cost Center Planning
1 -
S4 HANA
1 -
S4HANA
3 -
Sales and Distribution
1 -
Sales Commission
1 -
sales order
1 -
SAP
2 -
SAP Best Practices
1 -
SAP Build
1 -
SAP Build apps
1 -
SAP Cloud ALM
1 -
SAP Data Quality Management
1 -
SAP Maintenance resource scheduling
2 -
SAP Note 390635
1 -
SAP S4HANA
2 -
SAP S4HANA Cloud private edition
1 -
SAP Upgrade Automation
1 -
SAP WCM
1 -
SAP Work Clearance Management
1 -
Schedule Agreement
1 -
SDM
1 -
security
2 -
Settlement Management
1 -
soar
2 -
SSIS
1 -
SU01
1 -
SUM2.0SP17
1 -
SUMDMO
1 -
Teams
2 -
User Administration
1 -
User Participation
1 -
Utilities
1 -
va01
1 -
vendor
1 -
vl01n
1 -
vl02n
1 -
WCM
1 -
X12 850
1 -
xlsx_file_abap
1 -
YTD|MTD|QTD in CDs views using Date Function
1
- « Previous
- Next »
Related Content
- Building Low Code Extensions with Key User Extensibility in SAP S/4HANA and SAP Build in Enterprise Resource Planning Blogs by SAP
- Advanced WIP reporting in S/4HANA Cloud Public Edition in Enterprise Resource Planning Blogs by SAP
- Register now: SAP S/4HANA Cloud, Public Cloud – Partner Certification Academies in Enterprise Resource Planning Blogs by SAP
- Insights on Columnar store for SAP Functional Consultants in Enterprise Resource Planning Blogs by Members
- Do SAP PM Functional consultant has demand in the United states? in Enterprise Resource Planning Q&A
Top kudoed authors
| User | Count |
|---|---|
| 2 | |
| 2 | |
| 2 | |
| 2 | |
| 2 | |
| 2 | |
| 2 | |
| 2 | |
| 1 | |
| 1 |