- SAP Community
- Products and Technology
- Technology
- Technology Blogs by SAP
- Custom R Component - Normal Distribution Test
- Subscribe to RSS Feed
- Mark as New
- Mark as Read
- Bookmark
- Subscribe
- Printer Friendly Page
- Report Inappropriate Content
Many statistical or predictive methods assume data to be normally distributed. The residuals of a linear regression for example should be normally distributed, as should be measures that are analysed in a t-test.
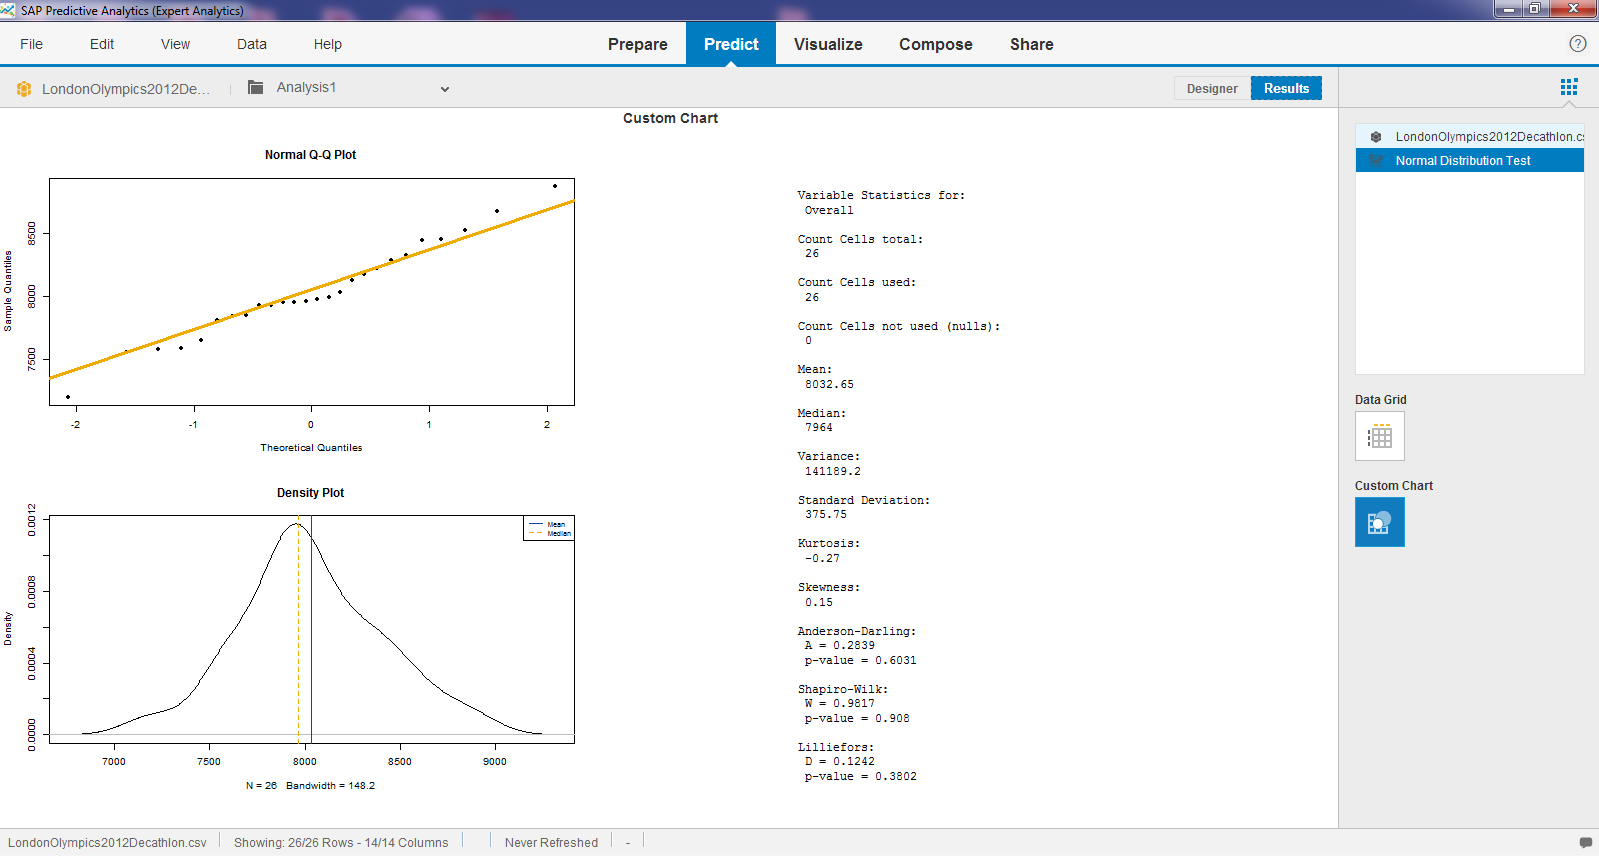
This component helps understand how closely a numerical variable follows a normal distribution.
There are a number of options to assess such a resemblance. Often it is a personal choice of the user which methods to use. I personally prefer
- A density plot, that visualises the distribution
- A QQ-Plot, which should show the data points on a straight line
- Skewness as measurement for the asymmentry, which should be close to 0 for a Normal distribution.
- Kurtosis as measurement for the "peakedness" as Wikipedia puts it, which should also be close to 0 for a Normal distribution.
Other measurements calculated by this component are
- Anderson-Darling
- Shapiro-Wilk
- Lilliefors

Disclaimer
Please note that this component is not an official release by SAP and that it is provided as-is without any guarantee or support. Please test the component to ensure it works for your purposes.
Prerequisites
- R libraries e1071, gplots, nortest and stats must be installed.
Limitations
Anderson-Darling is calculated when the dataset contains more than 7 values.
Lilliefors is calculated for datasets with more than 4 values.
Shapiro-Wilk is calculated for datasets between 3 and 5000 values.
Usage
These parameters can be set by the user.
| Parameter | Description |
|---|---|
| Variable to test for Normal Distribution | Your numerical variable. |
No output columns added by this component.
How to Implement
The component can be downloaded as .spar file from GitHub. Then deploy it as described here. You just need to import it through the option "Import/Model Component", which you will find by clicking on the plus-sign at the bottom of the list of the available algorithms.
Example
You can try out the component wtih our own data or with the file LondonOlympics2012Decathlon.csv, which lists the number of points collected by the various athletes competing in the Decathlon at the London Olympics 2012. The total points collected for instance appear fairly close to a normal distribution (see column "Overall"). This is shown in the screenshot at the top of this article.
- SAP Managed Tags:
- SAP Predictive Analytics
You must be a registered user to add a comment. If you've already registered, sign in. Otherwise, register and sign in.
-
ABAP CDS Views - CDC (Change Data Capture)
2 -
AI
1 -
Analyze Workload Data
1 -
BTP
1 -
Business and IT Integration
2 -
Business application stu
1 -
Business Technology Platform
1 -
Business Trends
1,658 -
Business Trends
91 -
CAP
1 -
cf
1 -
Cloud Foundry
1 -
Confluent
1 -
Customer COE Basics and Fundamentals
1 -
Customer COE Latest and Greatest
3 -
Customer Data Browser app
1 -
Data Analysis Tool
1 -
data migration
1 -
data transfer
1 -
Datasphere
2 -
Event Information
1,400 -
Event Information
66 -
Expert
1 -
Expert Insights
177 -
Expert Insights
296 -
General
1 -
Google cloud
1 -
Google Next'24
1 -
Kafka
1 -
Life at SAP
780 -
Life at SAP
13 -
Migrate your Data App
1 -
MTA
1 -
Network Performance Analysis
1 -
NodeJS
1 -
PDF
1 -
POC
1 -
Product Updates
4,577 -
Product Updates
342 -
Replication Flow
1 -
RisewithSAP
1 -
SAP BTP
1 -
SAP BTP Cloud Foundry
1 -
SAP Cloud ALM
1 -
SAP Cloud Application Programming Model
1 -
SAP Datasphere
2 -
SAP S4HANA Cloud
1 -
SAP S4HANA Migration Cockpit
1 -
Technology Updates
6,873 -
Technology Updates
420 -
Workload Fluctuations
1
- I need to implement a thing called “Vector” in Technology Blogs by SAP
- Cloud Integration: AMQP Adapter, Client Certificate, Solace PubSub+ [2]: Certificate Chain in Technology Blogs by SAP
- Solution for Rubik’s Cube of E-Invoicing in SAP Document and Reporting Compliance in Technology Blogs by Members
- Distribute data to child node via allocation(Probably)-SAC Template in Technology Q&A
- Deep dive into Q3 2023, What’s New in SAP Cloud ALM for Implementation Blog Series in Technology Blogs by SAP
| User | Count |
|---|---|
| 36 | |
| 25 | |
| 17 | |
| 13 | |
| 8 | |
| 7 | |
| 7 | |
| 6 | |
| 6 | |
| 6 |