
- SAP Community
- Groups
- Interest Groups
- Application Development
- Blog Posts
- The case for other tools
Application Development Blog Posts
Learn and share on deeper, cross technology development topics such as integration and connectivity, automation, cloud extensibility, developing at scale, and security.
Turn on suggestions
Auto-suggest helps you quickly narrow down your search results by suggesting possible matches as you type.
Showing results for
Former Member
Options
- Subscribe to RSS Feed
- Mark as New
- Mark as Read
- Bookmark
- Subscribe
- Printer Friendly Page
- Report Inappropriate Content
03-09-2015
5:15 AM
Although this post is not directly about ABAP development, I think its relevant to most ABAPers. For people in the ABAP world, it’s unusual stray far from SAP's suite of Development tools. However having additional skills can add a lot of value, especially with SAP's pivot towards using more open standards and tools (think UI5, D3.js). The embedded developer tools within a browser are one such set of tools, as we will see below:
After a recent upgrade to SAP CRM, we had issues with the SAP CIC. Attempts at launching the CIC would result in a service not reached error. These are usually an easy fix because the inactive service is displayed on the error page. Once in a while though, someone gets an error which looks like this (fig. 1, click to enlarge), for which even the mighty Google doesn't have a solution.
HTTP://host:port/sap<!DOCTYPE html PUBLIC"-//W3C//DTD HTML 4.01Transitional//EN"><html> <head><title>Logon Error Message</title> ….

As many of us have experienced, these never-seen-before issues tend to get discovered during the critical stage of the project, which also happens to be a Friday evening of a long week :smile: . It being a critical phase, It was important to analyze and fix the issue right away so I began the analysis immediately with the usual set of tools: ABAP Debugger, ICM, ICF, Logs etc. After spending considerable time with these to and not making much progress, it seemed worthwhile to start the analysis afresh and from a different perspective. This time I decided to begin the analysis at the opposite end of the problem i.e. instead of starting the analysis at the server (SAP), starting the analysis at the client (browser) using the embedded developer tools.
For those who have made this far, the obvious question is how does one go about doing this? Firstly, To launch the developer tools , look under the browser tools menu or use the shortcut key Ctrl/Cmd + Shift + I (works under many browsers) . Once launched, they will automatically start collecting and displaying the relevant data. Under the developer tools, there are tabs focussing on a specific function such as network analysis, DOM inspection, Stylesheets, Debugger etc. The names of these tabs can be different on different browsers.The next step would be to launch the CIC (or the relevant webpage). Since the issue I was facing was an unreachable service, it made sense to start with the network analysis tool. It’s a good default tool to start with as it will give an idea to the order of calls and the services called. An example of its output can be seen below (fig 2):

Here you can see the HTTP requests made by the browser to the server and the corresponding responses. From the 'Path' column (first column), it’s easy to determine the resource requested. The 'Initiator' column also holds important information, usually a hyperlink to the source of the request (when available). Double clicking on the request will provide additional details on the request and its response plus other details.
For my issue, it was relatively easy to find the HTTP request that called the non reachable service (in red). Usually the CIC will keep sending polling requests so it may a good idea to stop recording the traffic once the page loads what we need. Just by looking at the error URL (fig. 1 & 2), it was evident that the browser was trying to reach a service that would not exist in SAP. The next step was to figure out how this requested URL was formed. The bad URL could either be formed using a string delivered by SAP, or it could be the result of JavaScript(js) that did some unexpected manipulation in the browser. For the HTTP request we found above, the initiator was a js function, which was conveniently linked to in the Initiator column. This would serve as the starting point for our next step, by taking us to the Sources(debugger) tab to display the js triggering the HTTP request.
A little more about the Sources tab before we proceed further: all js loaded for a webpage can be seen under the Sources tab. The tab, along with displaying the js, can also be used to debug any js that executes in the browser. The debugger is very similar to the ABAP debugger with the ability to traverse the stack, lookup values of global and local variables, set breakpoints and watchpoints etc. Having found the code that made the HTTP request, it was time to work backwards to the source of the bad URL. Using the same approach used to debug ABAP code, we setup relevant breakpoints in the call stack plus watchpoints as desired to start debugging.
During debugging, I was able to find the function where the bad URL is actually formed (fig. 4, click to expand). The function is mergeManglingURL in the file crmuifServer.js, under the BSP crm_ui_start. The function performs its job perfectly well, serving us a URL that led nowhere because the parameter mangling has a long and incorrect string value. On a side note, the contents of the parameter ‘mangling’ seemed to be a well formed HTML page by itself, so I saved the contents of mangling to a separate file for examination later. At this stage, the cause was the incorrect value in the mangling parameter. I followed the trail down the rabbit hole further to determine what put the incorrect value in the parameter but reached a dead end.

At this stage, instead of debugging further, I wanted to examine the contents of mangling that I had saved separately. It had looked like valid HTML and I believed/hoped that it might hold clues to the root cause of this issue. After verifying the consistency of the HTML, I was able to open it up in a browser. The HTML was successfully rendered as shown below, finally displaying the service name that was actually inactive(fig. 5):
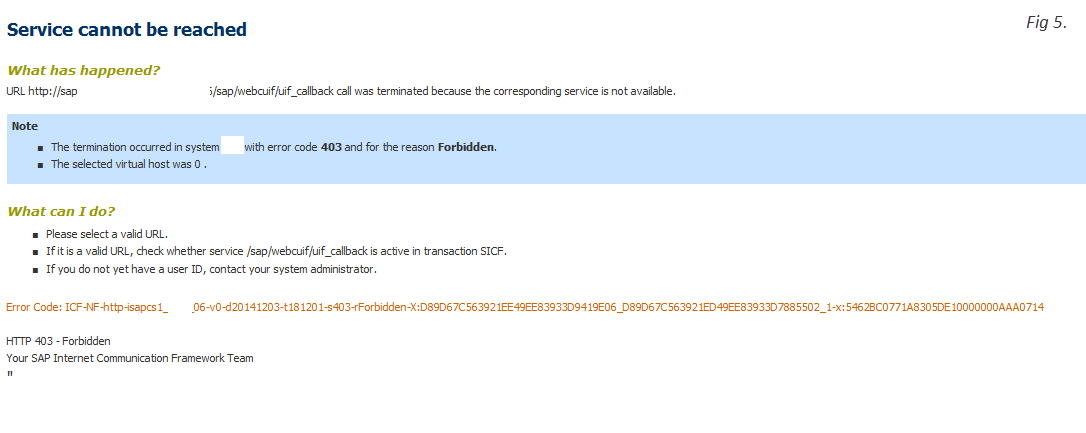
Upon activating the service uif_callback, I had the CIC up and running immediately. This is where I stopped the investigation which may seem a little anticlimactic, but the job was done and Friday evening was close to turning into Saturday morning :smile: .
A little more analysis on Monday revealed we had missed steps from note 1115493, which is in addition to note 1295006. (LINK).
To conclude, I hope I convinced you to play around with the developer tools inside your browser if you haven't already and also demonstrated an unconventional approach to solving the issue of an inactive service, where the service name in the error page looks like HTML markup.
- SAP Managed Tags:
- ABAP Development
You must be a registered user to add a comment. If you've already registered, sign in. Otherwise, register and sign in.
Labels in this area
-
A Dynamic Memory Allocation Tool
1 -
ABAP
8 -
abap cds
1 -
ABAP CDS Views
14 -
ABAP class
1 -
ABAP Cloud
1 -
ABAP Development
4 -
ABAP in Eclipse
1 -
ABAP Keyword Documentation
2 -
ABAP OOABAP
2 -
ABAP Programming
1 -
abap technical
1 -
ABAP test cockpit
7 -
ABAP test cokpit
1 -
ADT
1 -
Advanced Event Mesh
1 -
AEM
1 -
AI
1 -
API and Integration
1 -
APIs
8 -
APIs ABAP
1 -
App Dev and Integration
1 -
Application Development
2 -
application job
1 -
archivelinks
1 -
Automation
4 -
BTP
1 -
CAP
1 -
CAPM
1 -
Career Development
3 -
CL_GUI_FRONTEND_SERVICES
1 -
CL_SALV_TABLE
1 -
Cloud Extensibility
8 -
Cloud Native
7 -
Cloud Platform Integration
1 -
CloudEvents
2 -
CMIS
1 -
Connection
1 -
container
1 -
Debugging
2 -
Developer extensibility
1 -
Developing at Scale
4 -
DMS
1 -
dynamic logpoints
1 -
Eclipse ADT ABAP Development Tools
1 -
EDA
1 -
Event Mesh
1 -
Expert
1 -
Field Symbols in ABAP
1 -
Fiori
1 -
Fiori App Extension
1 -
Forms & Templates
1 -
General
1 -
Getting Started
1 -
IBM watsonx
1 -
Integration & Connectivity
10 -
Introduction
1 -
JavaScripts used by Adobe Forms
1 -
joule
1 -
NodeJS
1 -
ODATA
3 -
OOABAP
3 -
Outbound queue
1 -
Product Updates
1 -
Programming Models
13 -
Restful webservices Using POST MAN
1 -
RFC
1 -
RFFOEDI1
1 -
SAP BAS
1 -
SAP BTP
1 -
SAP Build
1 -
SAP Build apps
1 -
SAP Build CodeJam
1 -
SAP CodeTalk
1 -
SAP Odata
1 -
SAP UI5
1 -
SAP UI5 Custom Library
1 -
SAPEnhancements
1 -
SapMachine
1 -
security
3 -
text editor
1 -
Tools
17 -
User Experience
5
Top kudoed authors
| User | Count |
|---|---|
| 3 | |
| 3 | |
| 3 | |
| 2 | |
| 2 | |
| 2 | |
| 2 | |
| 1 | |
| 1 | |
| 1 |